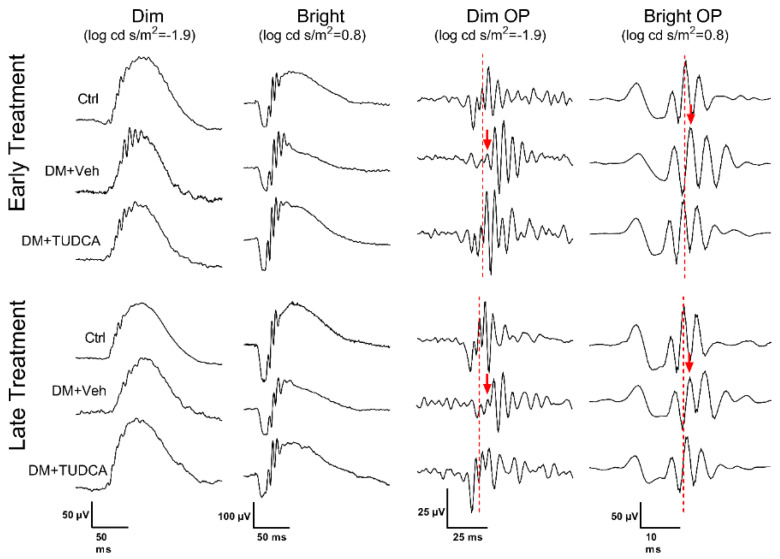
Figure 3.
Representative waveforms from dim (log cd s/m2 = −1.9) and bright (log cd s/m2 = 0.8) stimuli, as well as filtered OPs, at week 8 post-STZ for both early and late treatment. Dashed lines indicate the peak of OP2 in the Ctrl waveform, whereas the red arrows indicate the delayed peak of OP2 in the DM+Veh animals.

