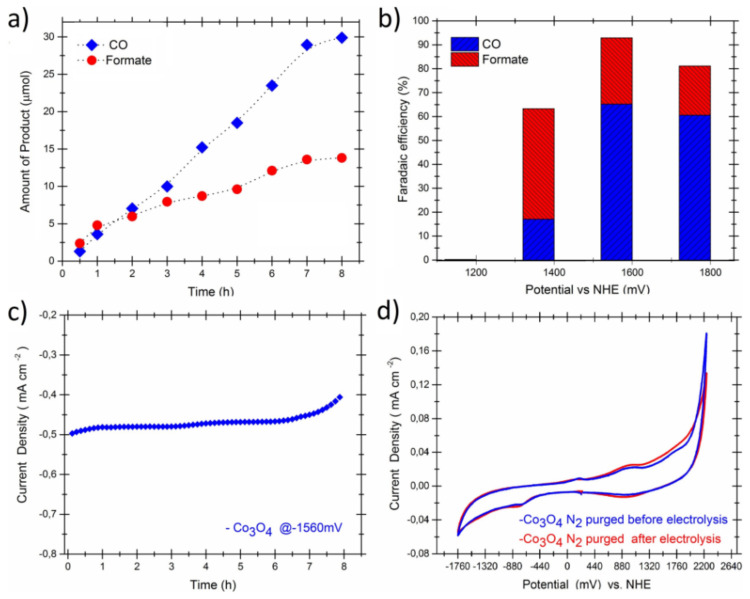
Figure 5.
Electroreduction of CO2 via the nanofibrous Co3O4, (a) increase in the amount of CO gas and formate as a function of time at a regular electrolysis potential of −1560 mV vs. NHE, (b) the electrolysis voltage versus the faradaic efficiency, (c) the chronoamperometry results, (d) Cyclic voltammograms of the electrode nanofibers measured before and after the electrolysis at a scan rate of 30 mV s−1. Reproduced from [131], with permission from Elsevier, 2018.

