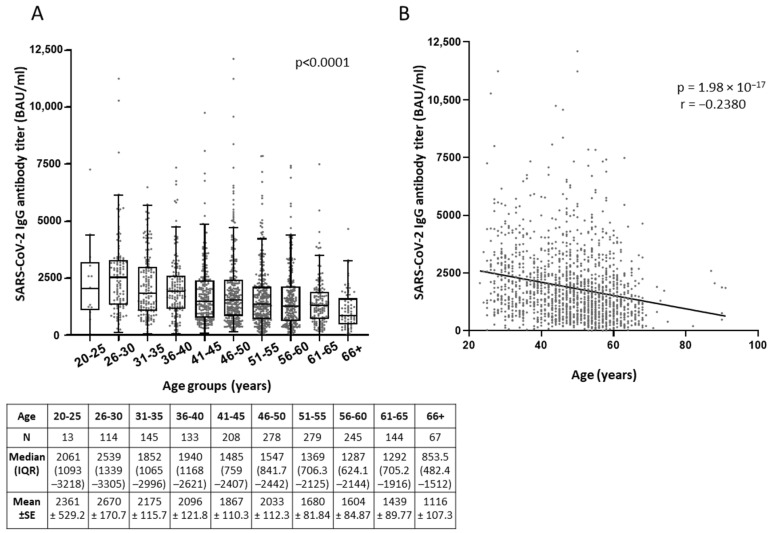
Figure 1.
Correlation of anti-SARS-CoV-2 IgG antibody titers with the age of healthcare workers from the three hospitals Eginition, Evan/smos, and Kon/poulio (total population), after vaccination with the BNT162b2 mRNA vaccine. (A) Comparison of antibody titers (BAU/mL) among different age groups by One-Way ANOVA Kruskal-Wallis H test. Data are represented as XY scatter plot and box plots; line in the middle, median; box edges, 25th to 75th centiles; whiskers, range of values. Numeric results are presented in the table below. (B) XY scatter plot and fitted linear regression lines of anti-SARS-CoV-2 IgG titers versus age as continuous variable. Spearman’s correlation coefficient (r) and p values (p) were calculated.

