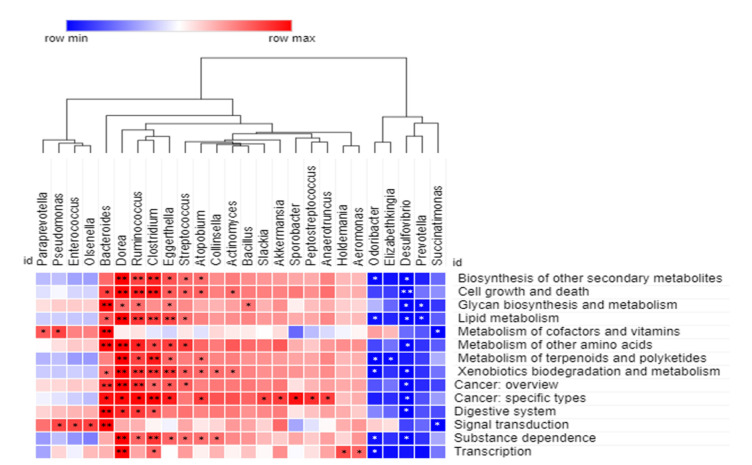
Figure 6.
Correlations between the bacterial experimental groups community and predicted functional profiles, based on 16S rRNA amplicon sequencing. Spearman correlation analysis heatmap constructed for each pairwise comparison between level 2 Kyoto Encyclopedia of Genes and Genomes (KEGG) pathways and bacterial taxa at the genus level. The positive and negative correlations are indicated in red and blue colors, respectively. The correlation was considered significant at ** p < 0.01 and * p < 0.05.

