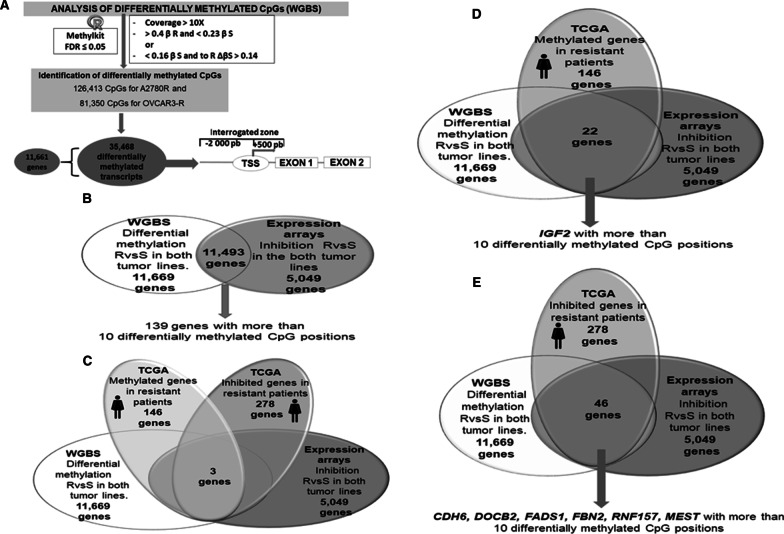
Fig. 6.
Identification of differentially methylated CpG dinucleotides through methylome sequencing and representation of cross-linked studies. A Data derived from whole genome bisulfite sequencing (WGBS) conducted in the ovarian cancer cell lines were analyzed by means of an FDR < 0.05, and two ranges of β values were implemented, one of them similar to that used in the first differential methylation analysis (β > 0.4 in R and < 0.23). Two additional β values were added to establish greater restrictiveness in sensitive samples, in which we expected to identify unmethylated cytosines (β < 0.16 in S) but allowing lower β values in resistance (Δβ of 0.14 between R and S) to capture small tendencies of methylation in resistance. These methylated positions were interrogated in typical promoter regions. B, C, D, E Representative Venn diagrams showing the candidate genes obtained from the cross-analysis of in vitro (methylome sequencing, expression arrays) and in silico information (data related to methylation and gene expression of selected patients from the TCGA). The results of these studies show the common genes derived from the assessed parameters. The other studies can be found in Additional file 12

