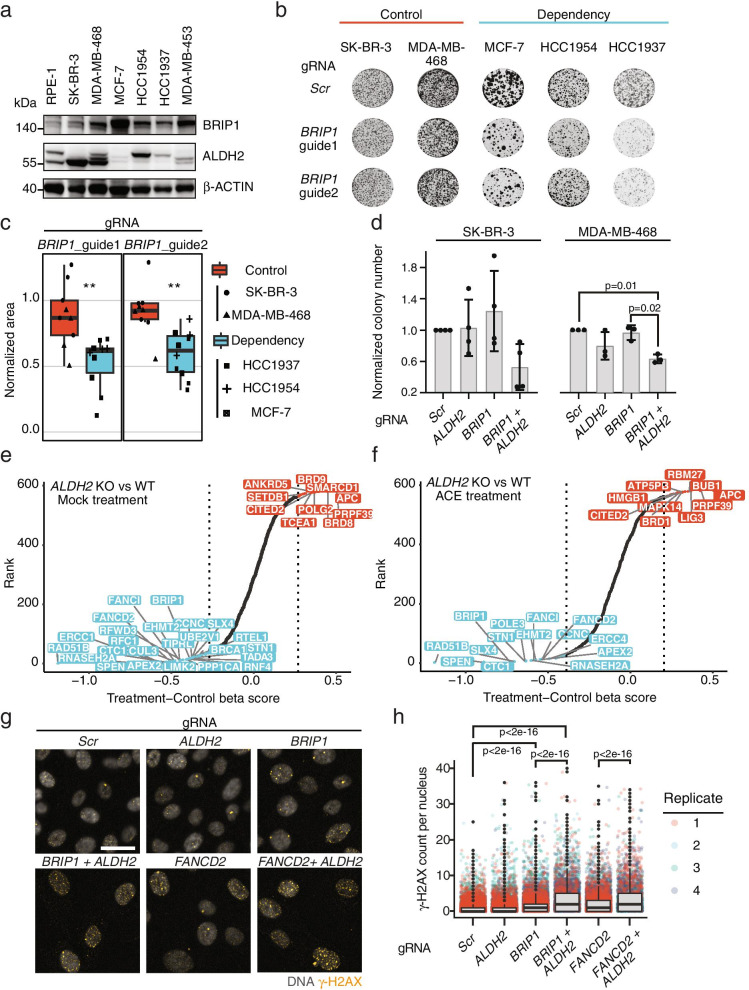
Fig. 5.
Validation of the dependency of low-ALDH2 expressing cells on BRIP1 expression. a Western blot of BRIP1 and ALDH2 in the indicated breast cancer cell lines. The lower migrating band corresponds to ALDH2. RPE-1 = RPE-1TP53−/− hTERT cells. Data are representative of 3 independent experiments. b Colony formation assay images of the indicated cell lines stably expressing Cas9 and transfected with a scrambled gRNA or 2 independent gRNAs targeting BRIP1. Colonies were stained with crystal violet 15 days post-transfection. Images are representative of ≥ 3 independent experiments. c Colony formation assay quantification in the control or dependency cell lines. The scrambled KO colony area is used for normalization. In the boxplots, centerlines mark the medians, box limits indicate the 25th and 75th percentiles, and whiskers extend to 5th and 95th percentiles. P-values are calculated based on Mann–Whitney U test (** p ≤ 0.01). d Colony formation assay quantification in MDA-MB-468 and SK-BR-3 stably expressing Cas9 and transfected with the indicated gRNAs. Bars represent normalized mean + standard deviation of 4 (SK-BR-3) or 3 (MDA-MB-468) independent experiments. The scrambled KO colony number is used for normalization. P-values are calculated with a one-way ANOVA test. Significant p-values are indicated. e, f Pooled CRISPR screen results. The beta scores differences between RPETP53−/−,ALDH2−/− and RPETP53−/− are showed as ranked plots, both in mock ( e) and ACE ( f) treatments conditions. Gene names with a negative beta score difference 2.5 bigger than the standard deviation are showed in light blue, top 10 gene names with a positive beta score difference are shown in light red. g Representative immunofluorescence images of RPE-1TP53−/− cells stably expressing Cas9 and transfected with the indicated gRNAs. Cell images were acquired 6 days post-transfection. Nuclei are pseudocolored in gray; the yellow dots mark γ-H2AX foci. Scale bar = 20 μm. h Quantification of γ-H2AX foci formation in RPE-1TP53−/− under the indicated conditions. Each dot indicates the number of foci/nucleus in each of the 4 biological replicates. P-values are calculated using a one-way ANOVA test. Selected significant p-values are indicated. The complete p-value list in provided in Additional file 4

