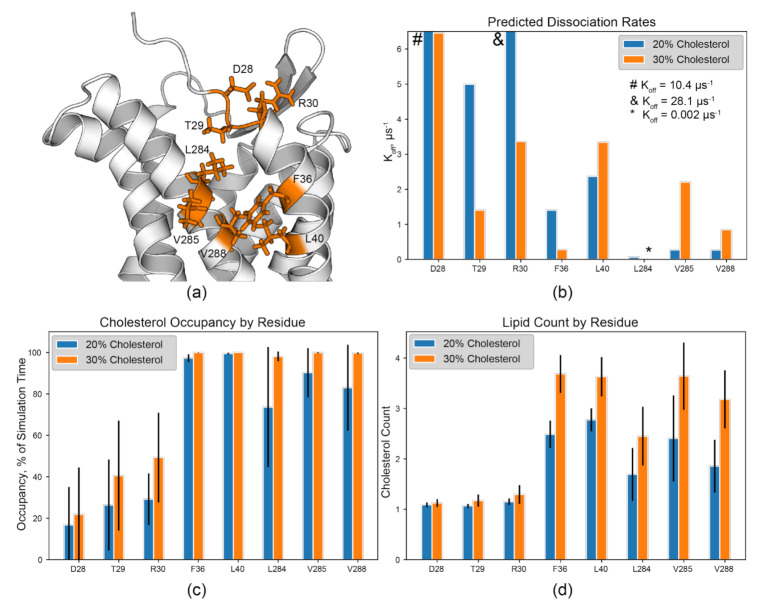
Figure 5.
The TM1/7 site as a potential CCR3 cholesterol binding site. (a) CARC and CARC-adjacent residues identified in the TM1/7 binding site, color coded as in Figure 4. R301.28–F361.34–L401.38 form the CARC motif in this binding site. (b) Predicted Koff values, (c) lipid occupancy as a percent of simulation time, and (d) lipid count from the 20% and 30% cholesterol simulations. Error bars indicate the standard deviation between replicates. Symbols (#, &, and *) denote values outside of the plot view.

