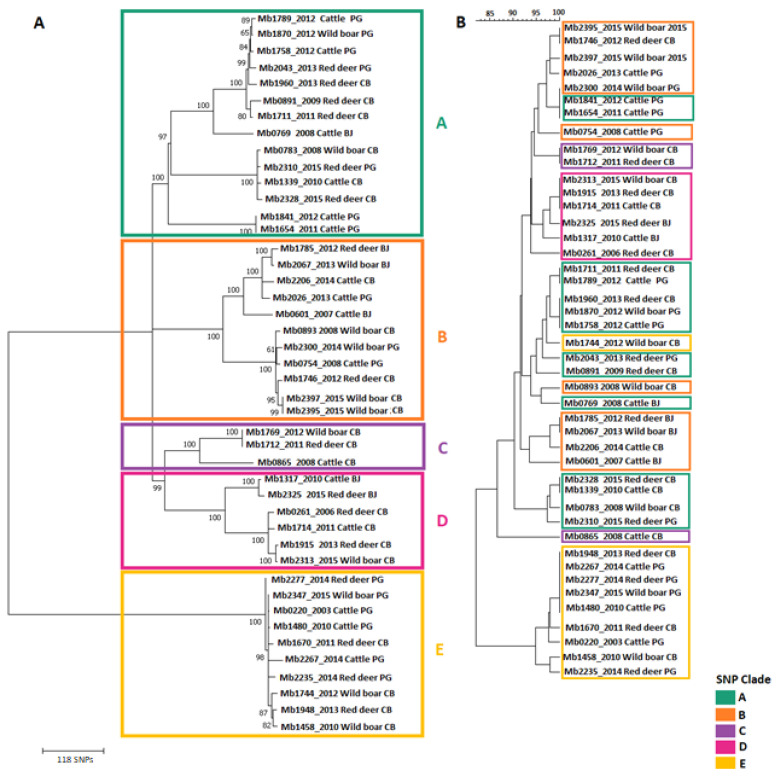
Figure 1.
Genetic relatedness of M. bovis field strains from TB hotspots in Portugal. (A) Maximum Likelihood Tree using GTR model with input taken as an alignment file containing only informative and validated SNPs. The tree is drawn to SNP scale. The bootstrap values are represented. (B) UPGMA tree, applying categorical option as a similarity coefficient, with input taken as the combined dataset based on spoligotyping and 8-loci MIRU-VNTR data. Colors identify the different SNP clades (A—dark cyan, B—orange, C—purple, D—pink and E—yellow).

