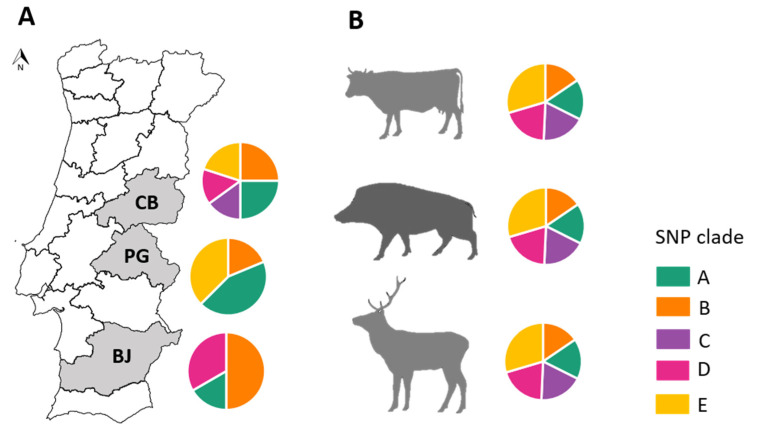
Figure 3.
Distribution of SNP clades by: (A) geographic region (Beja (BJ), Castelo Branco (CB) and Portalegre (PG)) and (B) host species. Pie charts represent the proportion of each SNP clade by geographic region or host species. The colors of the pie charts identify the different SNP clades (A—dark cyan, B—orange, C—purple, D—pink and E—yellow).

