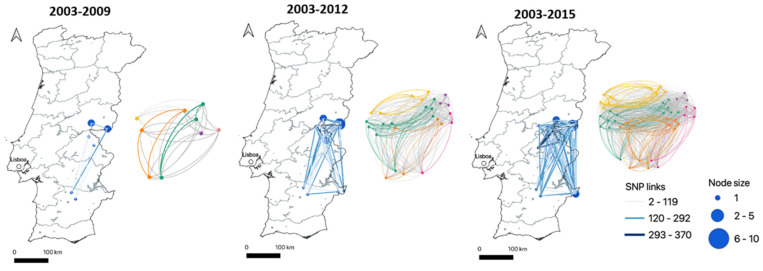
Figure 4.
Temporal evolution of the SNP network established for the 44 M. bovis recovered between 2003 and 2015. Three cumulative time periods were considered according to the epidemiological scenarios in Portugal (see methods). In the map of Portugal, the nodes represent M. bovis strains and the complexity of connections is based on the number of shared SNPs between strains. The side network evidences the relationship established between M. bovis grouped within the same clade—each node represents one M. bovis strain and the colors identify the connections according to SNP clade (A—dark cyan, B—orange, C—purple, D—pink, E—yellow and grey for connections between different clades).

