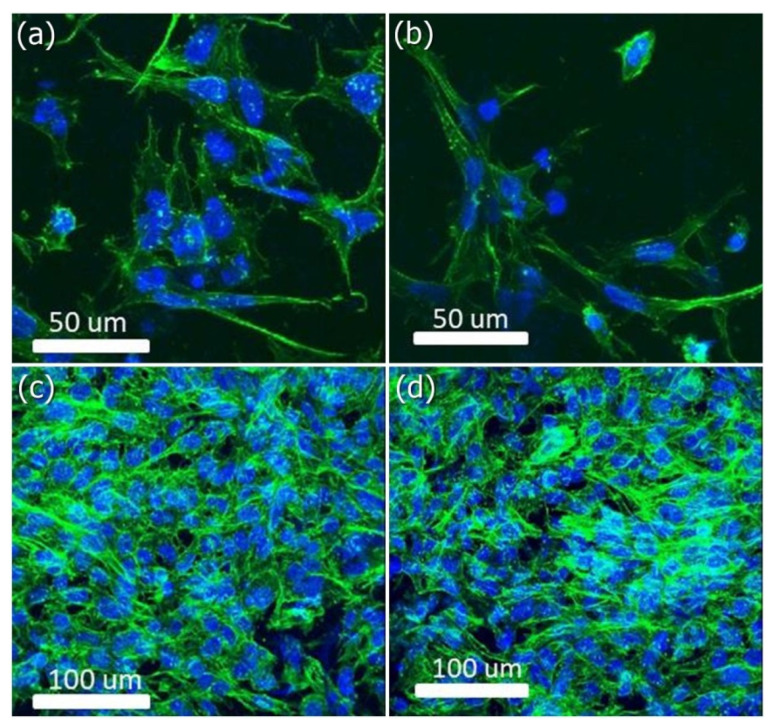
Figure 4.
Cellular morphology of MG63 osteoblast-like cells on matrix. Representative images of MG63 osteoblast-like cells cultured on SrHANF and HANF. (a,c) SrHANF and (b,d) HANF; (a,b) after one day of culture. (c,d) after four days of culture. Cytoskeletal F-actin was stained green with FITC, and cell nuclei were stained blue with DAPI.

