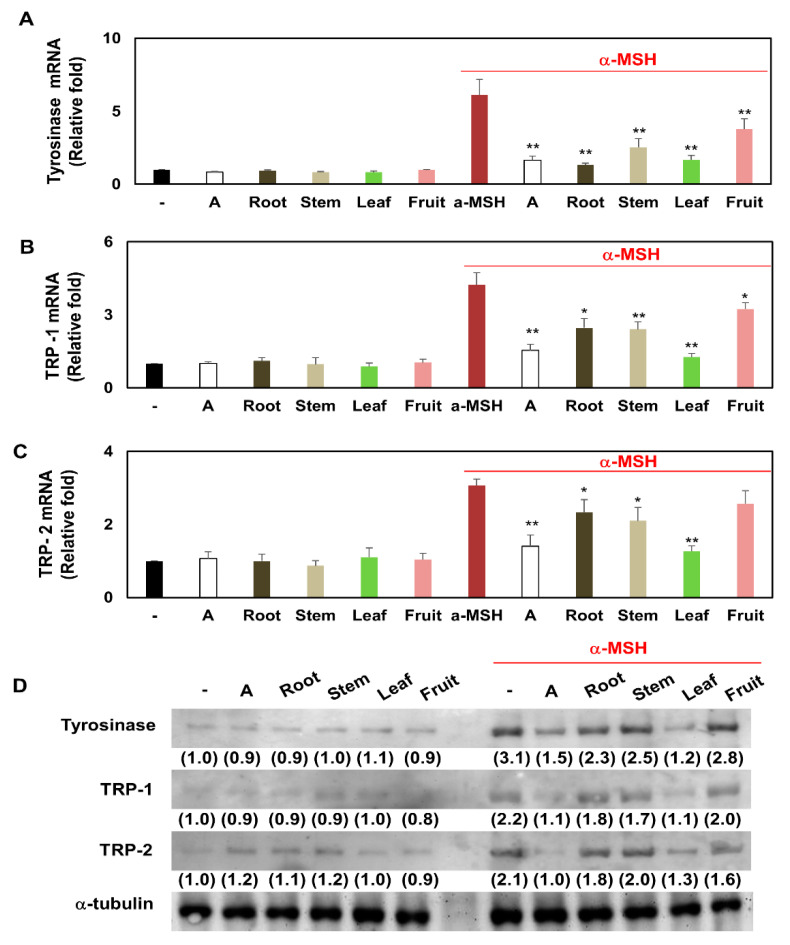
Figure 6.
The mRNA and protein expression of tyrosinase, TRP-1, and TRP-2 of KCR, KCS, KCL, and KCF extract in α-MSH-stimulated melanocytes. Melanocytes B16F10 were treated with KCR, KCS, KCL, and KCF extract (0.5 mg/mL) for 1 h after being treated to α-MSH (0.5 μM) or non-treatment. These melanocytes were maintained for 48 h. (A) Tyrosinase, (B) TRP-1, and (C) TRP-2 at the transcription levels were examined by real-time PCR. (D) Tyrosinase, TRP-1, and TRP-2 at the translation levels were investigated by western blot. * p < 0.05 and ** p < 0.01 (vs. α-MSH-stimulated group). Arbutin (A, 0.5 mg/mL) was used as a positive control. Data are expressed as mean ± SEM (n = 3).

