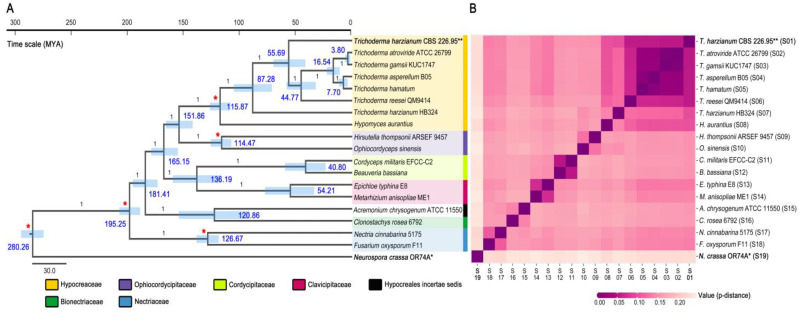
Figure 4.
Comparative analysis of Trichoderma mitogenomes—II. (A) Time-scaled Bayesian tree on Trichoderma mitogenomes that includes a new isolate of Trichoderma. Estimated chronological times were presented in time scale in the time scale of Mya (million years ago), with 95% confidence interval values in blue bars. Bayesian posterior probabilities (BPPs) values and calibration points were indicated at nodes using numbers (black) and asterisks (red), respectively. (B) Pairwise genetic distance among Hypocreales mitogenomes. All used fungal species (including N. crassa OR74A as an outgroup) and obtained p-distance values are described in Tables S5 and S10, respectively. Asterisks for the Neurospora crassa OR74A mitogenome (*) and T. harzianum CBS 226.95 mitogenome (**).

