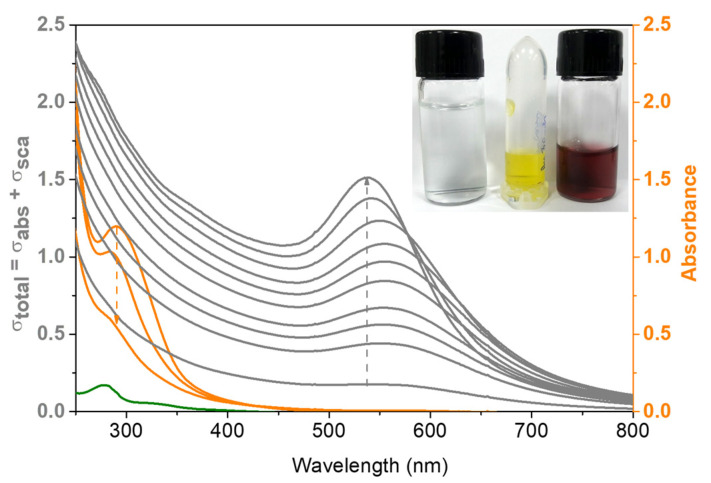
Figure 1.
UV-Vis spectra acquired during the time-course of the NanoBro synthesis. Green line shows the HEPES-buffered Bro solution. Orange lines show the spectral changes of HAuCl4 in subsequent times after addition to Bro solution as indicated by the arrow. Gray lines show the increase of absorbance and turbidity resulted from NanoBro formation. The inset shows a snapshot of the HEPES-buffered Bro transparent solution, the yellow HAuCl4 aqueous solution and the red-wine GNP suspension. The synthesis was carried out at pH 7.0 at the temperature of 40 °C and the spectra were obtained in a quartz cuvette with 1 cm of optical path.

