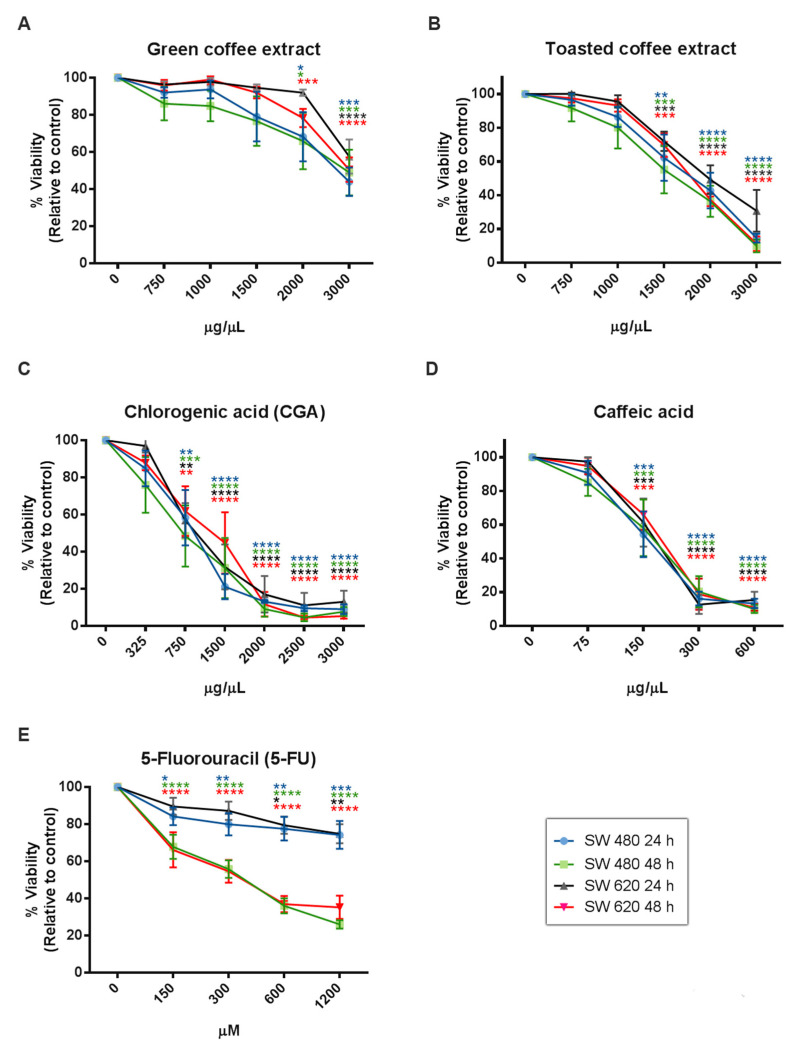
Figure 3.
Cytotoxicity activity measured by MTT in the colorectal cancer cell lines SW480 and SW 620. GC (A), TC (B), CGA (C), CA (D), and 5-FU (E). Values are expressed as mean ± SEM of at least three independent experiments. Two-way ANOVA, difference to non-treated cells, * p ≤ 0.05, ** p ≤ 0.01, *** p ≤ 0.001, **** p ≤ 0.00001.

