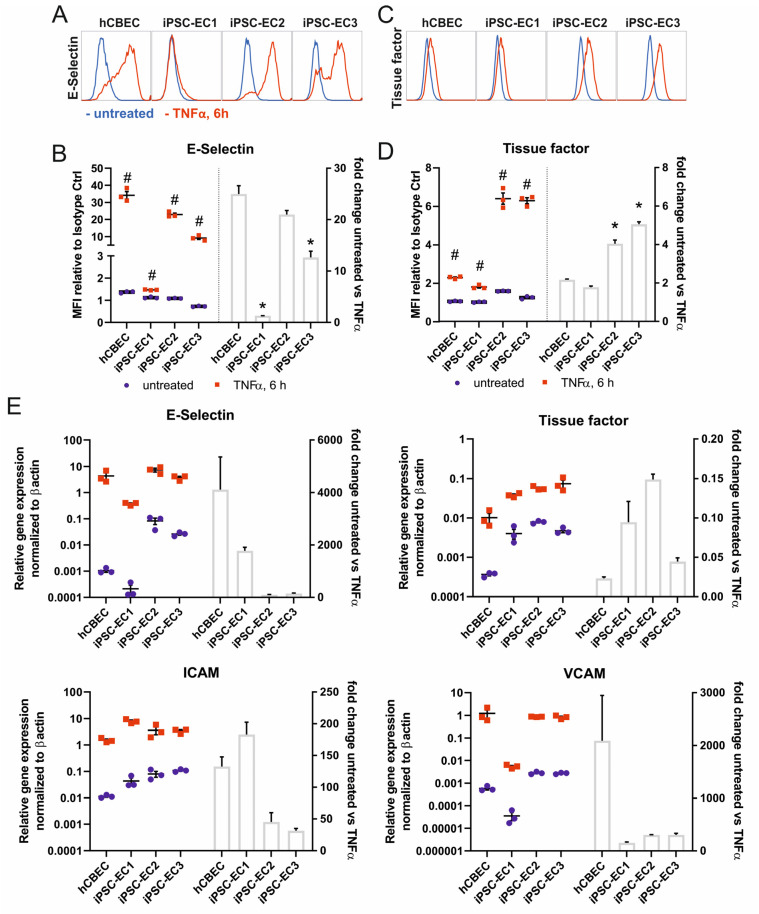
Figure 2.
iPSC-derived ECs seeded on fibronectin-coated PMP membranes show upregulation of markers of inflammation and hemostasis upon stimulation with 10 ng/mL TNFα for 6 h. (A) Flow cytometry analysis of E-selectin (CD62E) surface expression. Representative histograms of untreated (blue histograms) vs. TNFα-treated (red histogram) ECs. (B) Quantification of mean fluorescence intensities (MFI, represents geometric mean normalized to corresponding isotype controls) of E-selectin expression with flow cytometry (left) and calculated fold-change of untreated vs. TNFα-treated ECs (right). (C) Representative histograms of flow cytometry analysis ECs for tissue factor (CD142) surface expression. (D) Quantification of mean fluorescence intensity (MFI) of tissue factor surface expression with flow cytometry (left) and calculated fold-change of untreated vs. TNFα-treated ECs (right). (E) qPCR quantification of activation-relevant marker genes E-selectin, tissue factor, ICAM-1 and VCAM-1. The mRNA expression was normalized to the expression of β-actin using the ΔCt-method. All data are representative of 3 technical replicates for each EC type. Reported values are given as means ± standard error of mean. Differences were considered significant at p < 0.05. # Significantly different TNFα-treated vs. untreated. * Fold change significantly different vs. hCBECs.

