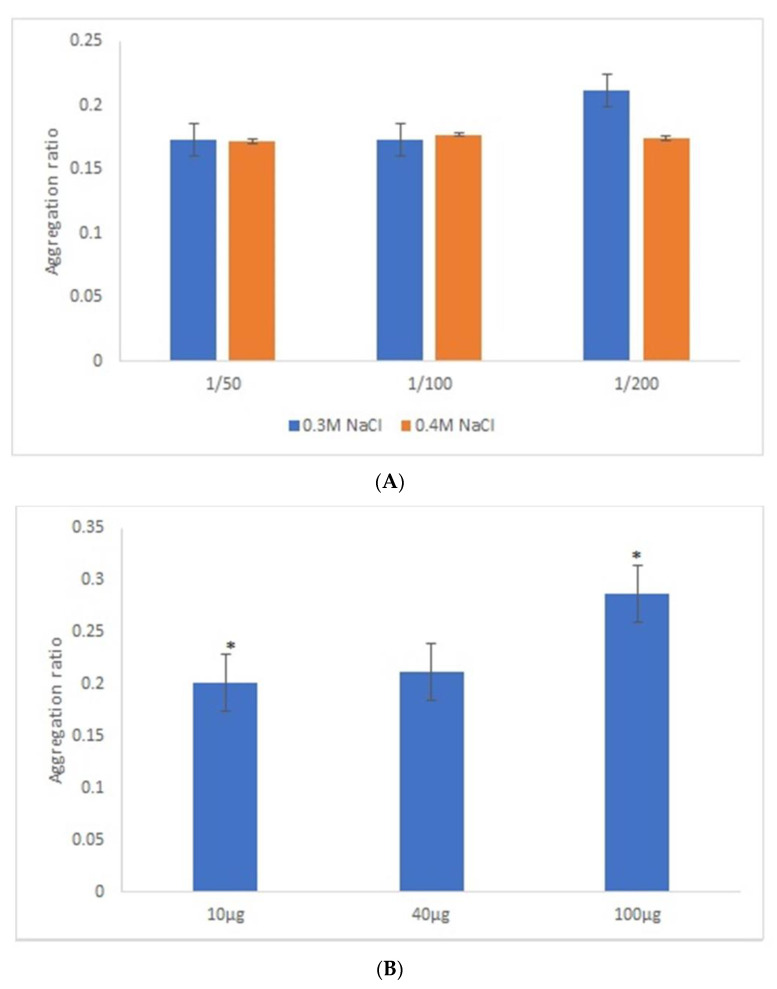
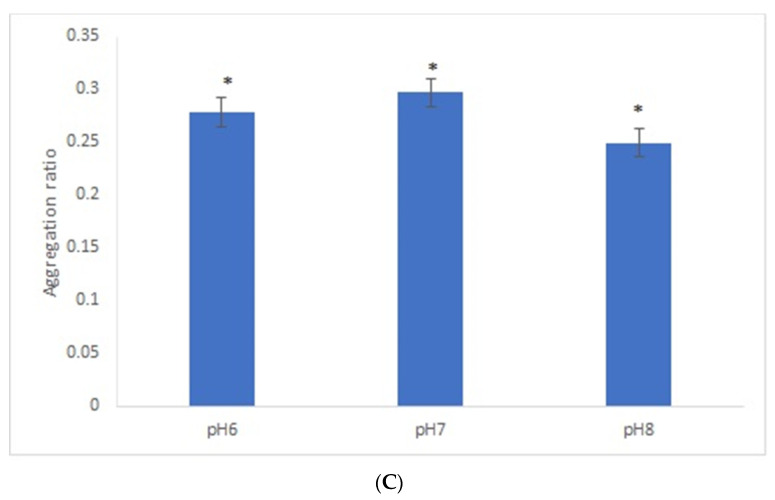
Figure 2.
Aggregation ratio variation between positive and negative serum samples for 28-nanometer AuNPs bioconjugated with GRA6II-BSA. (A) Three sera dilutions were tested (1/50, 1/100 and 1/200) and two NaCl concentrations (0.3 and 0.4 M). (B) The following three GRA6II-BSA concentrations were compared: 10, 40 and 100 µg/mL. (C) The following three pH values were compared: pH 6.0, pH 7.0 and pH 8.0. * represents statistically significant differences between aggregation ratio of positive and negative serum samples, for each experimental condition.


