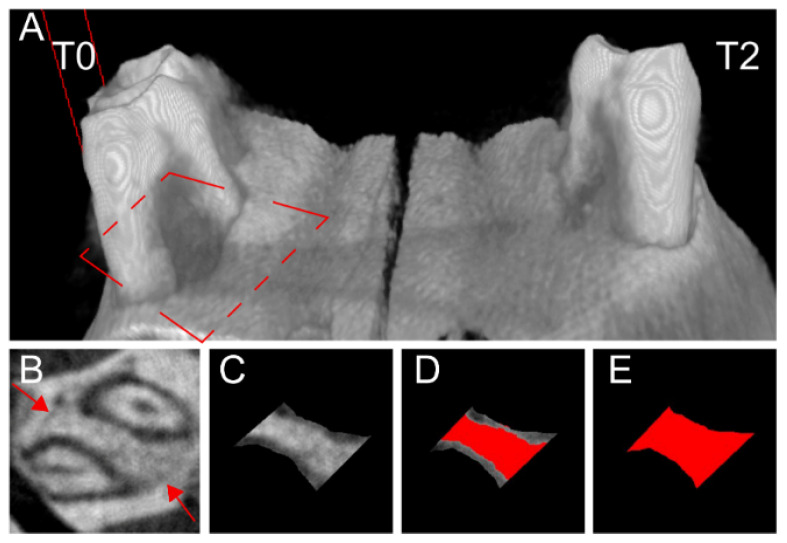
Figure 2.
Micro-computed tomography (Micro-CT) images after four weeks of periodontal furcation defect healing. Reconstructed three-dimensional image of the defects with a darker area between the left molar roots without treatment (T0), compared to the defect on the right side treated with decellularized amniotic membrane and undifferentiated adipose-derived stromal cells (T2) (A). A dashed rectangle indicates horizontal level orientation for bone healing quantification (A). Micro-CT image of a left-side furcation defect treated with T2 (B–E). The lower bone density of the newly deposited tissue can be observed, also demarcated by the defect preparation perimeter (arrows, (B)). Image processing for quantification using Image J software on level D, between medium and apical level, with 77% of bone tissue (C–E). The area between the roots was restricted with tangent lines, and the roots were contoured and excluded from the image (C). The area of mineralized tissue (red in (D)) was subtracted from the total area (red in (E)) to calculate the percentage of bone healing.

