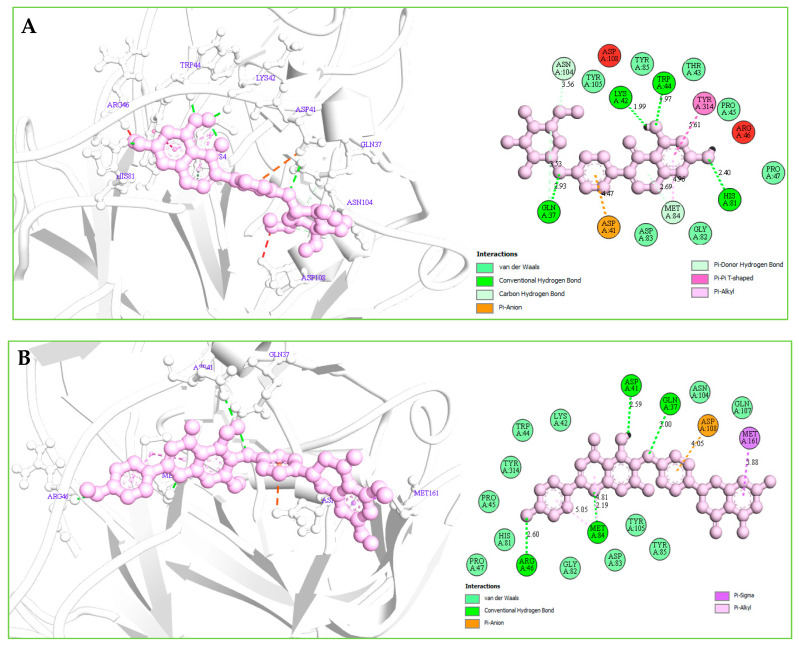
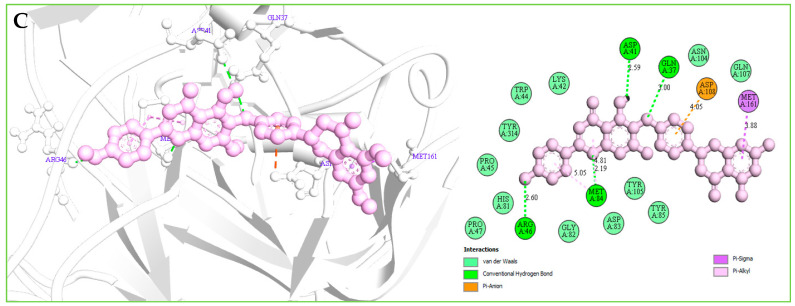
Figure 7.
(A): The interaction between the MERS-CoV S1-NTD and Amb1153724 compounds. The 3D interaction has represented left side of the figure, where 2D interaction has depicted in right side of the figure accordingly. (B): The interaction between the MERS-CoV S1-NTD and Amb23604659 compounds. The 3D interaction has represented left side of the figure, where 2D interaction has depicted in right side of the figure accordingly. (C): The interaction between the MERS-CoV S1-NTD and Amb23604659 compounds. The 3D interaction has represented left side of the figure, where 2D interaction has been depicted in the right side of the figure accordingly.


