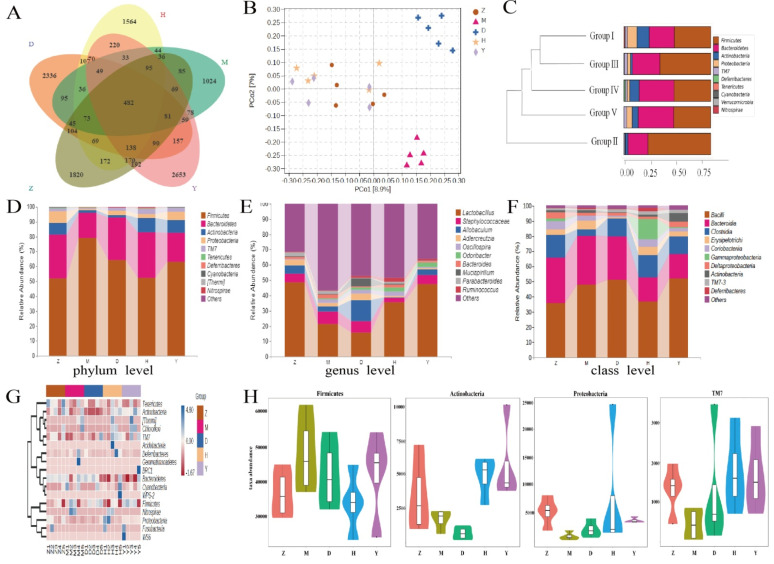
Figure 7.
The effect of CPE-E on gut microbiota structure. Venn diagram of OUT (A), PCoA (B), hierarchical clustering (C), abundance distribution at phylum level (D), abundance distribution at genus level (E), abundance distribution at class level (F), Heatmap (G), absolute abundance of gut microbial community at phylum level (H). Z: Group I (control group), M: Group II (potassium oxonate), D: Group III (2 g/kg BW CPE-E), H: Group IV (4 g/kg BW CPE-E), Y: Group V (5 mg/kg BW allopurinol).

