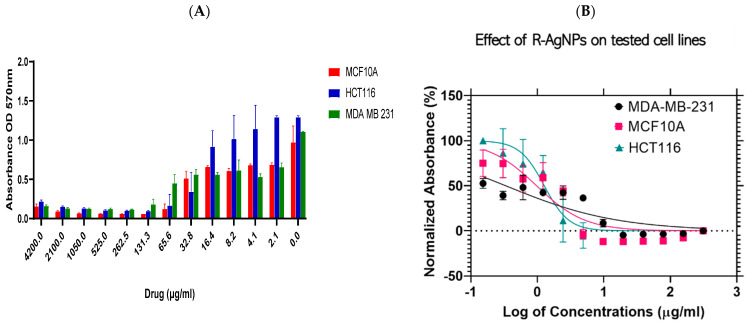
Figure 12.
Effect of R- AgNPs on the cell viability of normal and cancer cells. Bar graph showing dose relationship of R-AgNPs on the viability of two human cancer cell lines; HCT116 ( ) and MDA-MB-231 (
 ) and a normal cell line; MCF 10A (
 ) (A). Log dose-response relationship of R-AgNPs on the normalised viability of two human cancer cell lines; HCT116 (
 ) and MDA-MB-231 (
 ) and one normal cell line MCF 10A (
 ) (B). IC50 values of AgNPs on each cell line was calculated using Log viability vs. normalised response–variable slope (four-parameter).

