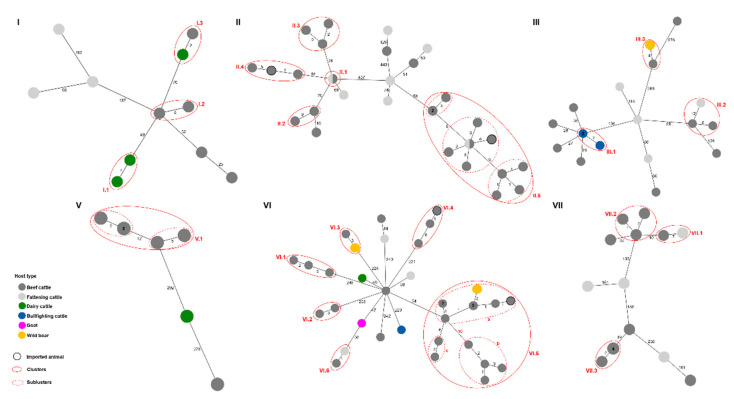
Figure 3.
Minimum spanning trees (MSTs) of the putative transmission clusters identified within the main WGS clades (I–III and V–VII) based on SNP analysis of 125 M. bovis isolates obtained in Catalonia, Spain, from 2008 to 2018. Nodes are colored according to host type. Clusters (solid red circles) and subclusters (dashed red circles) are identified. The nodes that have a black outline represent cattle imported into Catalonia from outside of Spain. Numbers inside nodes indicate the total number of isolates represented by that node. The numbers on the branches connecting the nodes represent the number of segregating SNP sites between a pair of nodes. MSTs were constructed using the whole-genome concatenated SNP sequences for each main clade and PHYLOViZ2.0 (https://online.phyloviz.net/index, accessed 29 July 2021).

