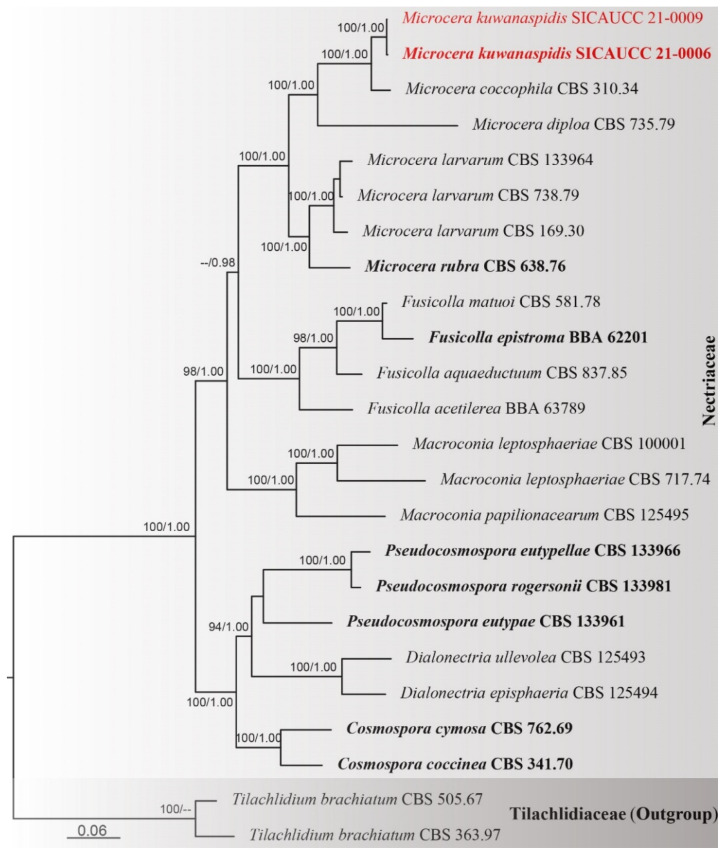
Figure 2.
Phylogram generated from RAxML analysis based on combined ITS, LSU, tef1-α, rpb1, rpb2, acl1, act, tub2, cmdA, and his3 sequence data of Microcera isolates. Bootstrap support values for maximum likelihood (ML, left) higher than 70% and Bayesian posterior probabilities (BYPP, right) equal to or greater than 0.95 are indicated at the nodes respectively. The sequences from ex-type strains are in bold. The newly generated sequence is in red.

