Figure 1.
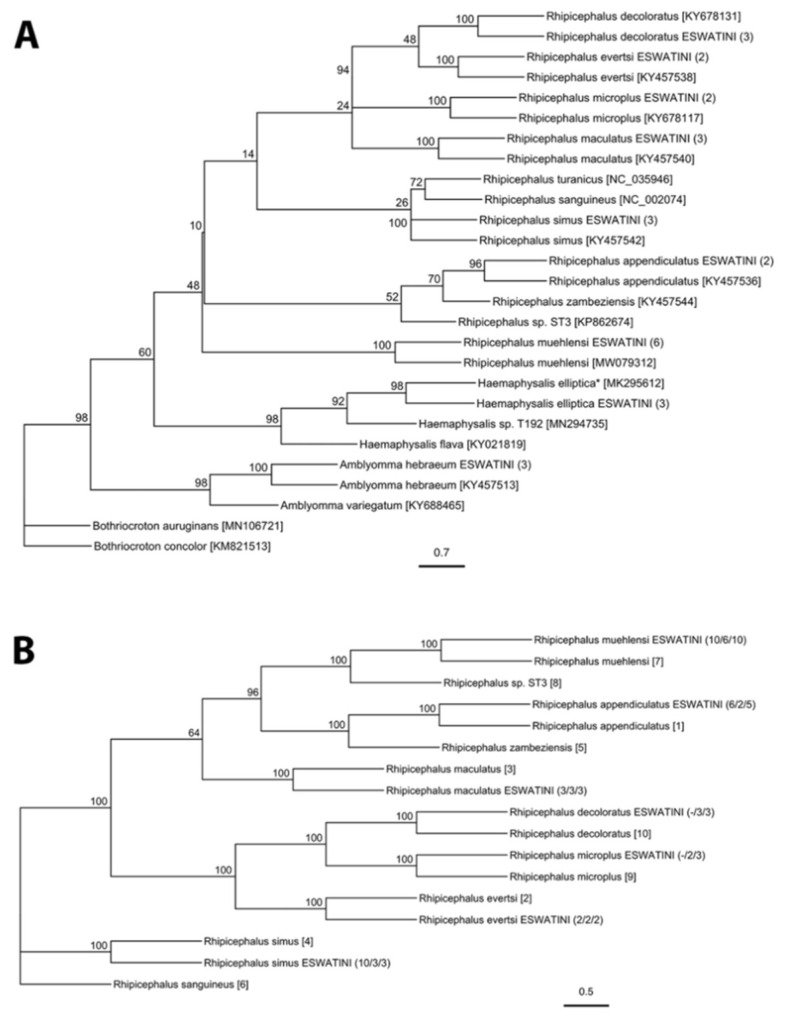
Phylogenetic analysis of tick sequences using (A) CO1 gene for all ticks in study and (B) concatenated 12S, CO1, and ITS2 gene sequences for Rhipicephalus species represented as maximum likelihood trees. Bootstrap values at the nodes represent the percent agreement among 1000 replicates. The branch length scale represents substitutions per site. The number of individual specimens that were sequenced from each lineage is indicated in parentheses. For (A) the Genbank accession numbers are indicated in brackets and for (B) the Genbank accession numbers for 12S/CO1/ITS2 are: [1] = KY457536/KY457536/KY457500; [2] = KY457538/KY457538/KY457503; [3] = KY457540/KY457540/KY457504; [4] = KY457542/KY457542/KY457508; [5] = KY457544/KY457544/KY457509; [6] = NC_002074/NC_002074/KY945496; [7] = MW080169/MW079312/NA; [8] = NA/KP862674/KP862668; [9] = EU921764/KY678117/KY457506; [10] = KF569940/KY678131/BDU97716. NA = reference sequence not available. * = GenBank sequence unverified.

