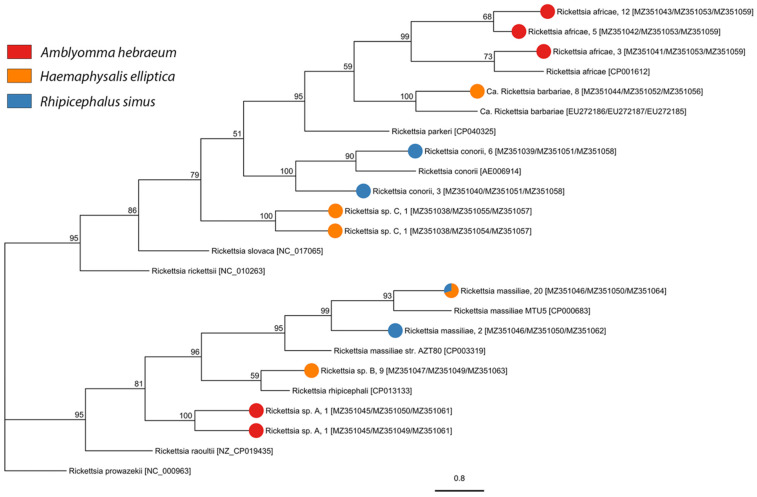
Figure 3.
Phylogenetic analysis of Rickettsia species and genotypes inferred from concatenated ompA, ompB, and gltA gene sequences using the maximum likelihood method with 1000 bootstraps. The tick species from which each Rickettsia isolate was sequenced in this study is represented by the colored pie chart at each tip, followed by the isolate name, the number of samples, and the Genbank accession numbers in square brackets ompA/ompB/gltA). Sequences obtained from GenBank are indicated by their name and accession number. Bootstrap supports, represented as percentages, are indicated on each node. The branch length scale represents substitutions per site.

