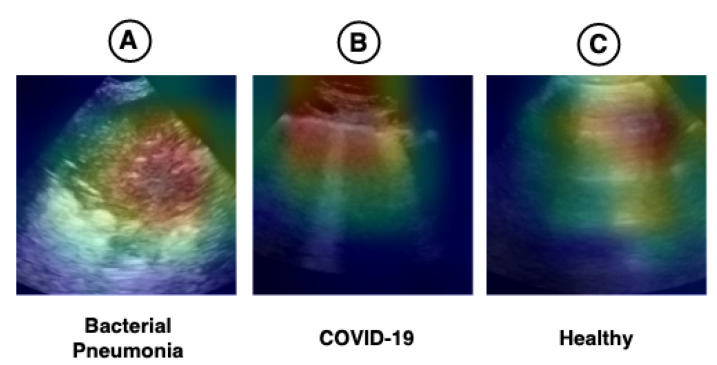
Figure 8.
Heat maps referring to the regions considered the most important for the model (Xception) according to the Grad-CAM technique. Image (A) shows a large consolidation area related to the diagnoses of bacterial pneumonia. Image (B) shows B-lines (vertical lines) and an irregular pleura line, both related to US diagnosis of COVID-19. Image (C) is a lung with a healthy diagnosis, where there are the named A-lines (horizontal lines) and a regular pleural line.

