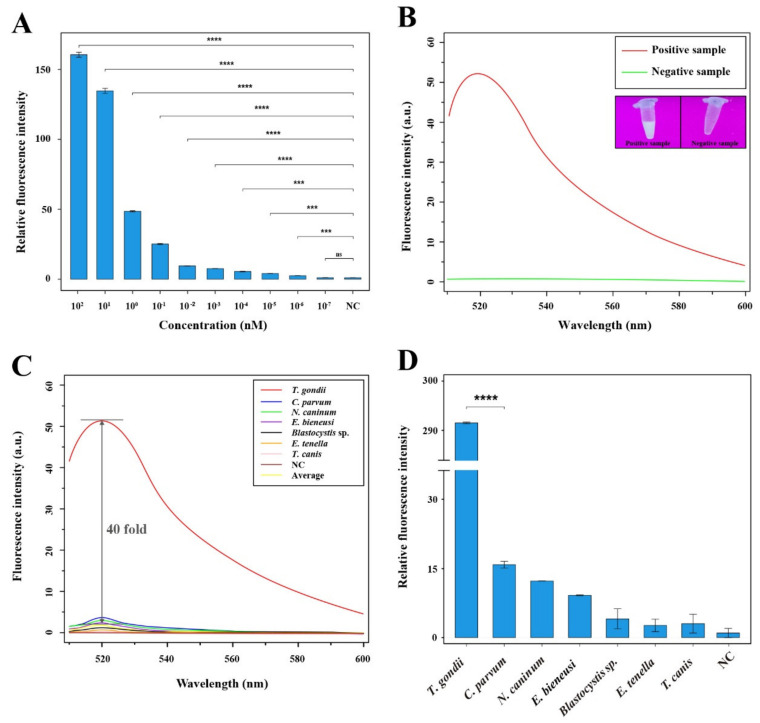
Figure 4.
Analysis of specificity and sensitivity of the RAA-Cas12a-Tg system. (A) Sensitivity of the RAA-Cas12a system for T. gondii detection. Relative fluorescence intensity was estimated by the formula of (Ft-F0)/(Fn-F0) × 100%, where Ft, F0, and Fn represent the fluorescence peak values of the positive recombinant pMD18-T-529 bp plasmids after dilution by 10-fold serial ranging from 102 to 10−7 nM, blank, and negative control, respectively. Error bars represent the mean standard deviation (SD), where n = 2 replicates. **** p ≤ 0.0001; *** p ≤ 0.001; ns p > 0.05. (B) Visual detection of signal amplification by the naked eye under a UV transilluminator and by an observation of microplate reader of the positive sample containing T. gondii DNA and the negative sample without T. gondii DNA. (C) Specificity of the RAA-Cas12a system for T. gondii detection. The nucleic acids of other six parasites including C. parvum, N. caninum, E. bieneusi, Blastocystis sp., E. tenella and T. canis were used to evaluate the specificity of the RAA-Cas12a-Tg system. Average represents the largest fluorescence intensity of other six parasites at plateau phase; NC stands for negative control. (D) Specificity of the RAA-Cas12a system for T. gondii detection. The relative fluorescence intensity of T. gondii detection using the RAA-Cas12a-Tg system was more significant than that of the closely related C. parvum and other five parasites. Error bars represent the mean SD, where n = 2 replicates. **** p ≤ 0.0001.

