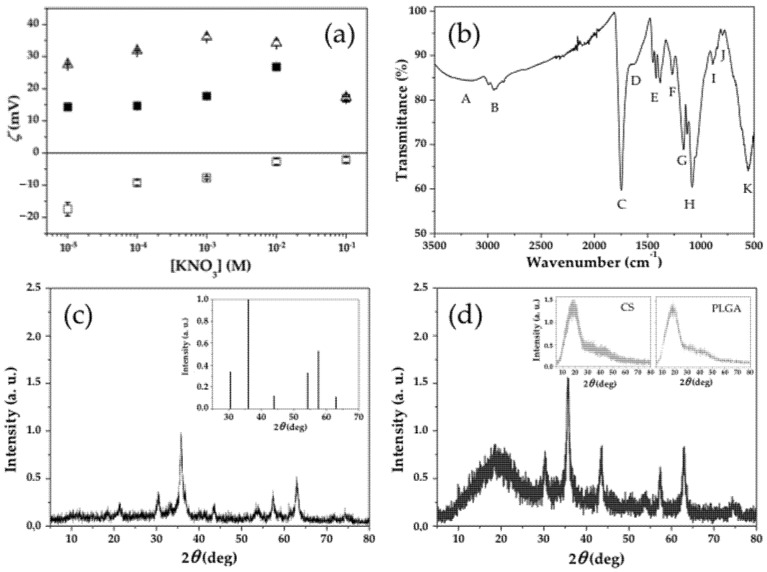
Figure 4.
(a) Zeta potential (ζ, mV) of (□) γ-Fe2O3/PLGA NPs, (Δ) CS NPs, and (■) (γ-Fe2O3/PLGA)/CS NPs as a function of the molar concentration of KNO3, at pH ≈ 6. Data is presented as mean value ± SD (n = 9). (b) Infrared spectra of the (core/shell)/shell NPs. (c) X-ray diffractogram of the γ-Fe2O3 particles. Inset: American Society for Testing and Materials (ASTM) pattern for γ-Fe2O3. (d) X-ray diffractogram of the (γ-Fe2O3/PLGA)/CS NPs. Inset: X-ray diffractograms of the CS particles, and PLGA particles. The intensity is expressed in arbitrary units (a. u.).

