Figure 10.
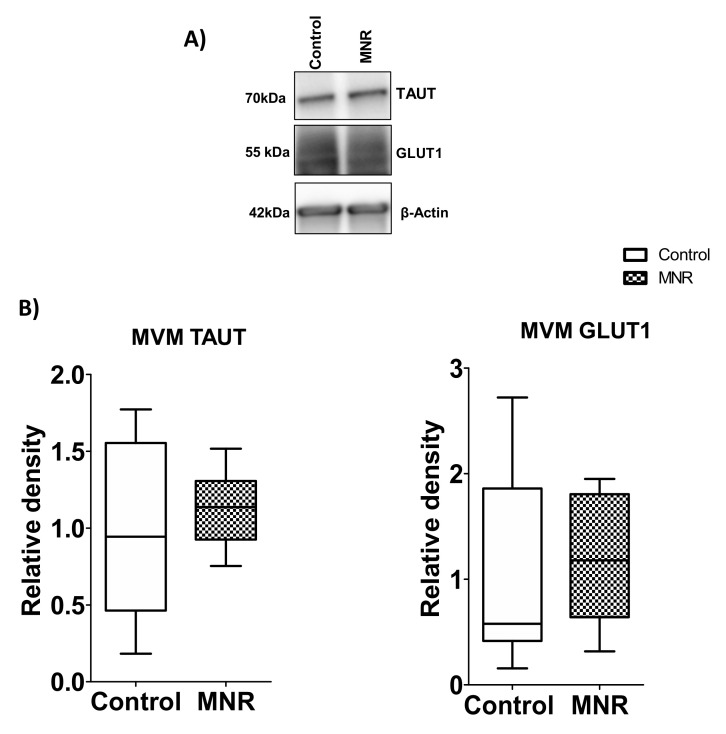
MVM TAUT and GLUT1 protein expression. (A) Western blot analysis of amino acid transporter isoforms TAUT and glucose transporter (GLUT1) in MVM isolated from control (C) and MNR (M) baboons at GD 140. (B) The histogram shows protein expression data of MVM TAUT and GLUT1. An equal amount of protein loading was performed. After the normalization of MVM TAUT and GLUT1 expression to loading control (β-actin), the average density of the control sample band was designated an arbitrary value of 1. Values are represented as Medians ± IQR. n = 9/each group. KS normality test p-value: MVM TAUT (Control, p > 0.10; MNR, p > 0.10; passed normality); MVM GLUT1 (Control, p = 0.04, not passed normality; MNR, p > 0.10; passed normality).

