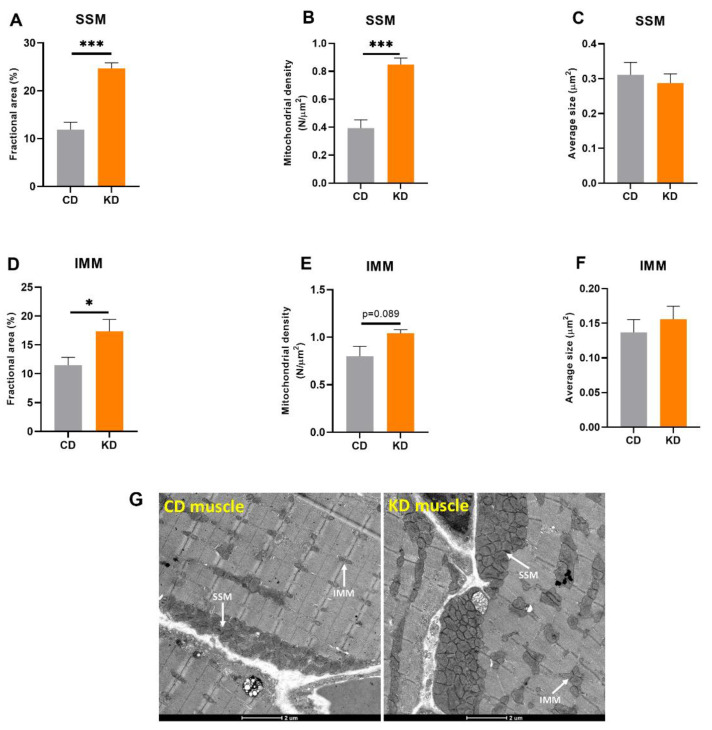
Figure 2.
Quantification of subsarcolemmal (SSM) and intermyofibrillar (IMM) mitochondrial mass in red gastrocnemius muscle (n = 4–5 mice, 10 images per mouse). Fractional area of (A) SSM and (D) IMM. Number density of (B) SSM and (E) IMM per micrograph. Average mitochondrial size of (C) SSM and (F) IMM. (G) Representative micrographs of red gastrocnemius muscle of CD and KD animals. Diets: CD = control, KD = Ketogenic. * p < 0.05, *** p < 0.001.

