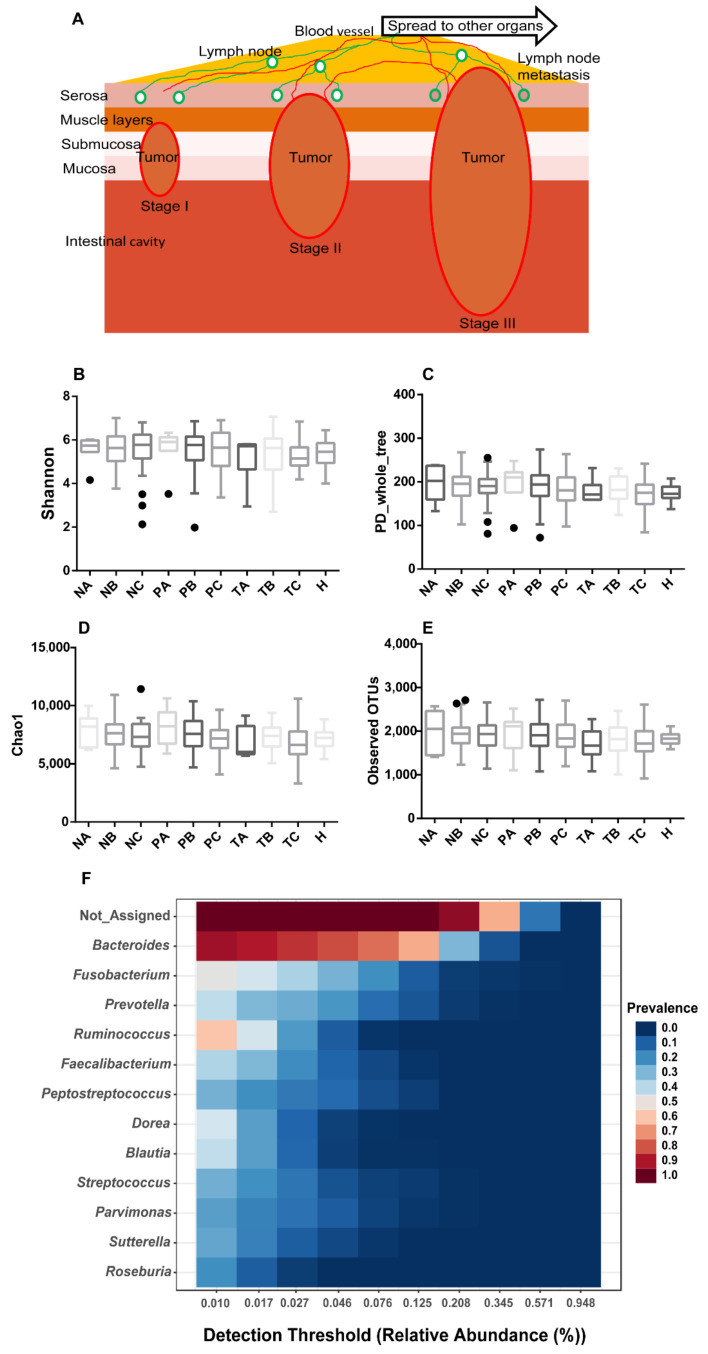
Figure 1.
Microbial alpha-diversities showing no significant difference in on-tumor (T), adjacent-tumor (P) and off-tumor (N) sites during CRC development and healthy controls (H). (A) Schematic diagram showing CRC developmental process from stage I to stage III. Invasion depth increases during CRC development and lymph node metastasis occurs in CRC stage III leading to distant metastasis. (B). Alpha diversity evaluated using Shannon diversity index. (C). Alpha diversity evaluated using PD whole tree index. (D). Alpha diversity evaluated using Chao1 index. (E). Alpha diversity evaluated using Observed OTU index. (F). Core microbiome analysis showing a limited number of genera prevalent across all the samples. Sample prevalence threshold is set up above 20%, and relative abundance threshold is set up above 0.01%. The heatmap colors represent the sample prevalence values. A: CRC stage I; B: CRC stage II; C: CRC stage III. N: off-tumor site; P: adjacent-tumor site; T: on-tumor site. PD: Phylogenetic Diversity. Alpha-diversity differences were compared using one-way ANOVA with Kruskal–Wallis test, p > 0.05.

