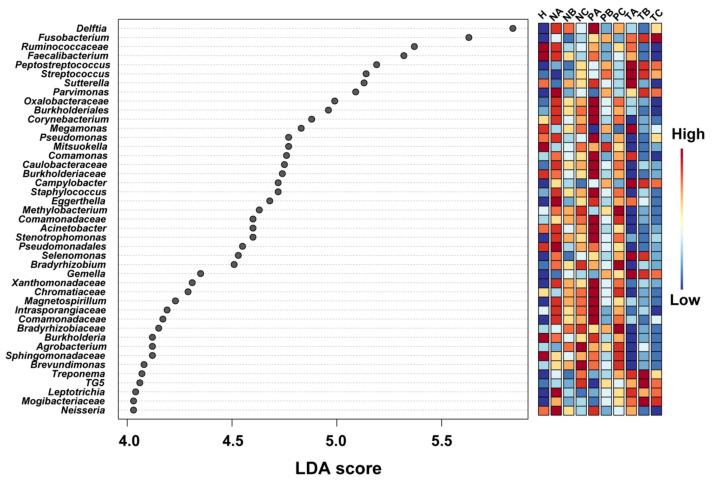
Figure 5.
LEfSe analysis showing the genera or families with unknown genus with significant differential abundances in N-, P- or T-sites at CRC stages I, II and III. The colors in the heatmap represent the abundances of genera/families with unknown genus. A: CRC stage I; B: CRC stage II; C: CRC stage III. N: off-tumor site; P: adjacent-tumor site; T: on-tumor site. H: healthy control. LefSe: the linear discriminant analysis (LDA) effect size.

