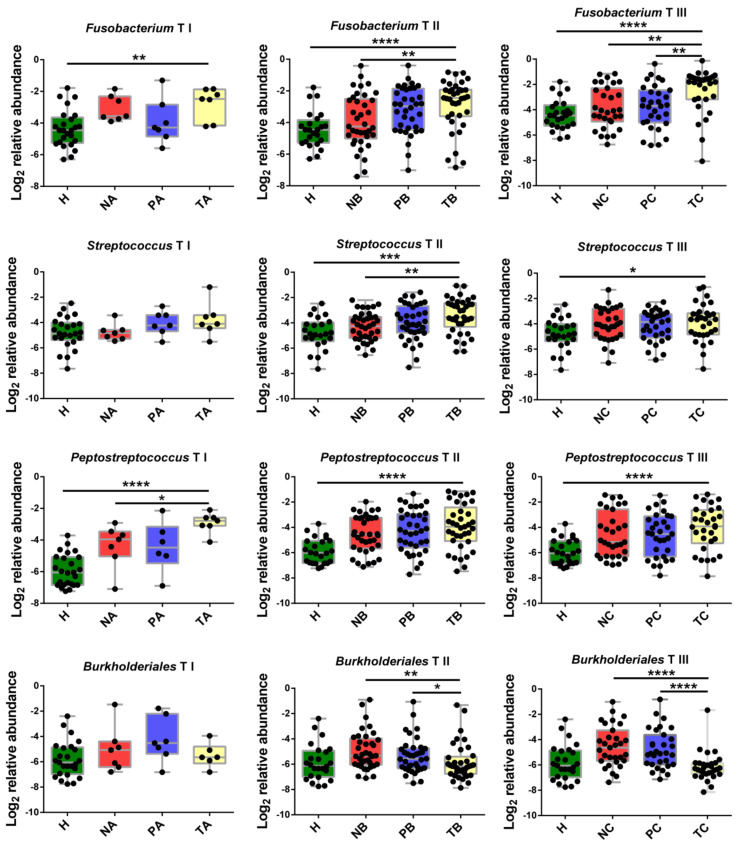
Figure 6.
Abundance change analysis of CRC stage-specific biomarkers including Fusobacterium, Streptococcus, Peptostreptococcus and Burkholderiales. A: CRC stage I; B: CRC stage II; C: CRC stage III. N: off-tumor site; P: adjacent-tumor site; T: on-tumor site. H: healthy control. Abundance change differences were compared using one-way ANOVA with Kruskal–Wallis test, *, p < 0.05; **, p < 0.1; ***, p < 0.01; ****, p < 0.001.

