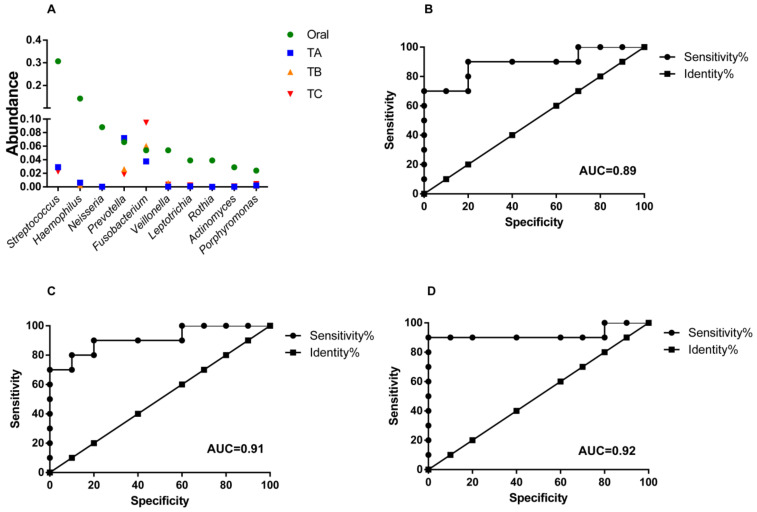
Figure 8.
Abundance comparison of the top abundant oral bacteria among those in on-tumor sites at CRC stages I, II and III. (A). Abundance change comparison. (B–D) Receiver operating characteristic curve analysis showing diagnostic performance of the top abundant oral bacteria, to differentiate CRC stage I and oral cavity (B), II and oral cavity (C), and III and oral cavity (D). Areas under the receiver-operating curve are 0.89 (B), 0.91 (C) and 0.92 (D). A: CRC stage I; B: CRC stage II; C: CRC stage III. N: off-tumor site; P: adjacent-tumor site; T: on-tumor site. H: healthy control. AUC: areas under the receiver-operating curve.

