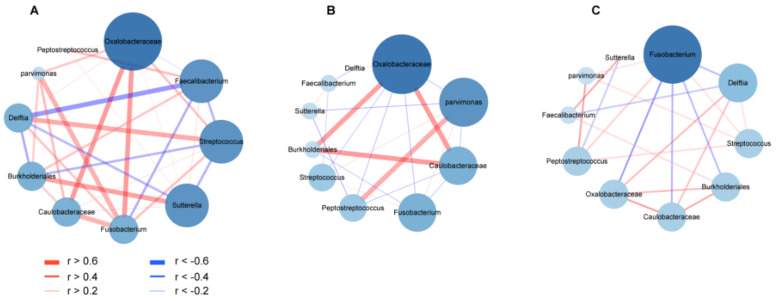
Figure 9.
Co-occurrence and co-excluding interaction networks of CRC stage-specific markers showing profiles of microbiome in on-tumor site during CRC progression. (A). Co-occurrence and co-excluding interaction networks at CRC stage I. (B). Co-occurrence and co-excluding interaction networks at CRC stage II. (C). Co-occurrence and co-excluding interaction networks at CRC stage III. Bacteria pairs with Spearman rank correlation >0.2 or <−0.2 are represented in the network. Edges represent co-occurrence or co-excluding interaction relationships between bacteria pairs. Cytoscape v3.7.2 was used for co-occurrence and co-excluding interaction network construction. The size of the nodes corresponds to edge degree.

