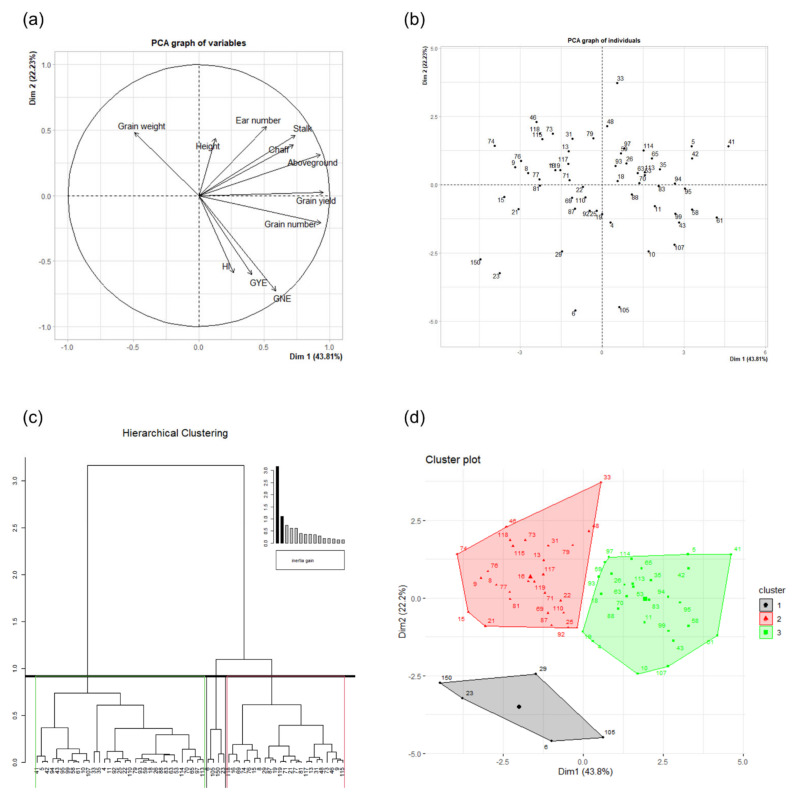
Figure 3.
Hierarchical clustering based on principal component analysis (PCA) for the 60 wheat genotypes grown under elevated CO2 and high-temperature conditions. GNE: grain number ear−1; GYE: grain yield ear−1; HI: harvest index. (a) The variables plot represents the correlation of traits with the PCA axes. (b) The individuals plot exhibits the position of genotypes in the PCA. (c) Hierarchical clustering of genotypes based on their distribution on the PCA. (d) Cluster plot of genotypes distributed in the PCA. PCA and hierarchical clustering were performed using individuals as the mean of the four replicates (n = 4) for each genotype.

