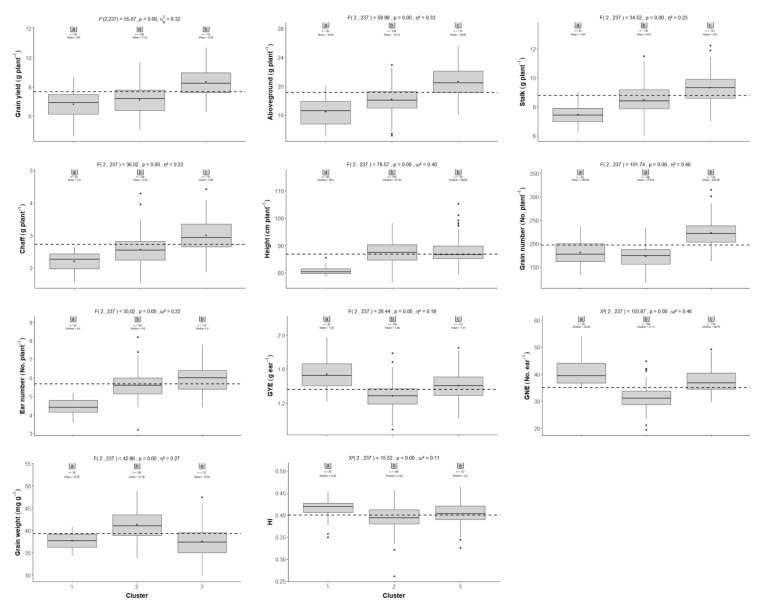
Figure 4.
Boxplot with ANOVA of wheat production and grain yield components for the three defined clusters of the 60 wheat genotypes grown under elevated CO2 and high-temperature conditions. GNE: grain number ear−1; GYE: grain yield ear−1; HI: harvest index. Black dots represent the mean of the replicates per cluster (Cluster 1, n = 20; Cluster 2, n = 108; Cluster 3, n = 112). The black dotted line represents the mean for all the genotypes and replicates (N = 240). Statistics (F and X2), degrees of freedom, p-value (p) and size of the effect (η² and ω²) for one-way ANOVA are added. Among columns, numbers followed by the same letter are not significantly different at p < 0.05 for post-hoc tests.

