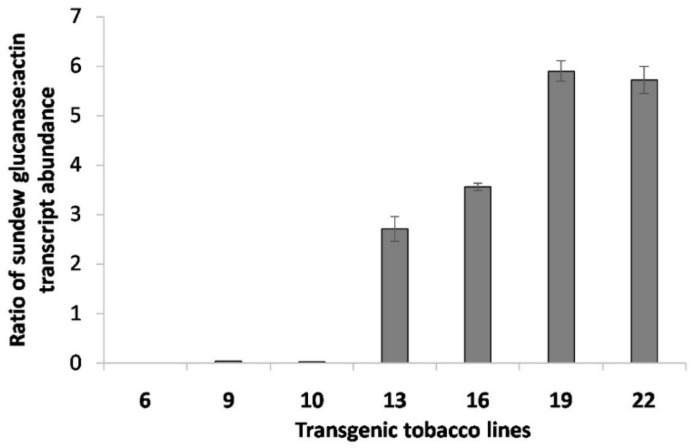
Figure 4.
Relative expression levels of the DbGluc1 gene in transgenic tobacco lines. Relative expression levels were calculated with the Pfaffl method as the ratio between transcript abundance of the target DbGluc1 transgene and the endogenous actin gene control. Normalisation was performed based on the amplification efficiency results from a 5 point 5-fold dilution standard curve (DbGluc1: E = 1.813, R2 = 0.999; actin: E = 1.854, R2 = 0.998). Error bars are standard deviations calculated from three independent biological samples, each with technical duplicates.

