Figure 2.
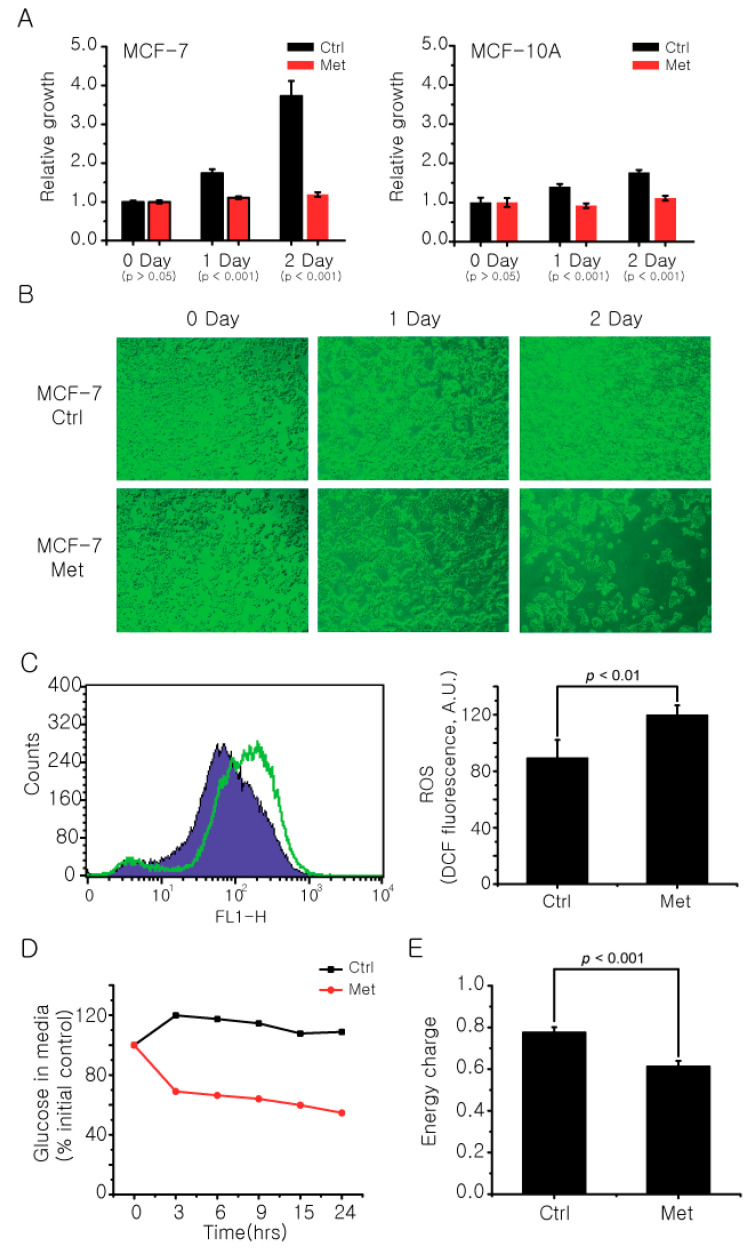
Metformin affects cancer cell growth and metabolic phenotypes. The final concentration of 20 mM metformin was treated to MCF-7 and MCF-10A cells for 2 days and the cell viability at each day was measured by a standard MTT assay (A) and microscope (B). (C) The change in ROS levels in MCF-7 cells after metformin treatment was measured using a fluorescent dye DCFH-DA. (D) The difference in glucose uptake by metformin treatment was compared by measuring glucose level in MCF-7 cell culture media using an NMR spectrometer. The relative amounts were normalized against the 0 h point. (E) The change in energy charge of MCF-7 cells after metformin treatment was calculated with absolute concentrations of AMP, ADP, and ATP measured with LC/MS using the following equation: ([ATP] + 0.5 [ADP])/([ATP] + [ADP] + [AMP]). Ctrl: control group; Met: Metformin treated group. The data are from three independent experiments. The error bars represent the standard deviation.

