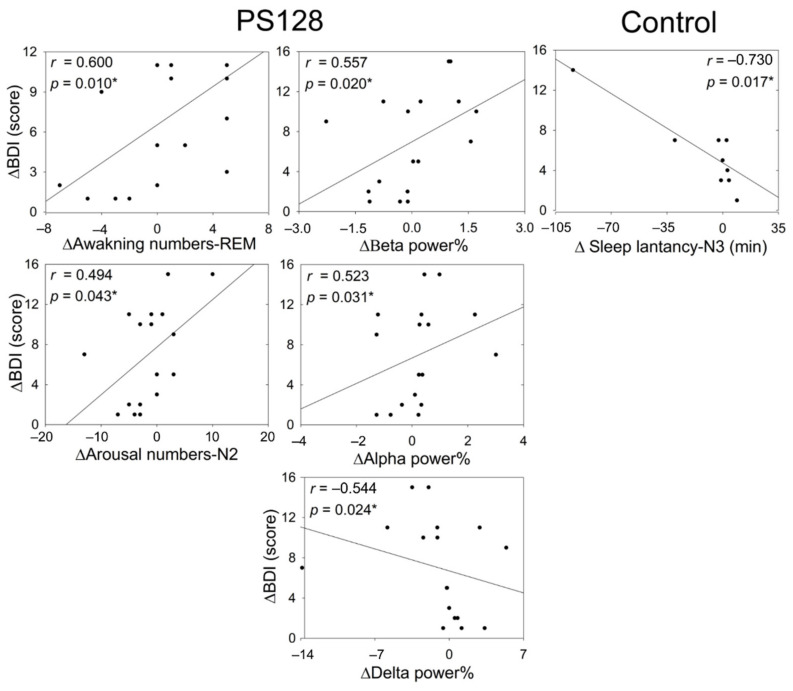
Figure 6.
Two dimensional scatter plots displaying the relationship between the change in BDI-II scores and the change in objective parameters from baseline to 4 weeks of treatment. The figure shows those parameters that are correlated to the △BDI. Control, n = 10; PS128, n = 17. * p < 0.05, Spearman rank correlation analysis. BDI-II, Beck Depression Inventory-II; REM, rapid eye movement stage; N2, non-REM (NREM) stage 2; N3, NREM stage 3; △ in scores as the day 0 score minus the day 30 score.

