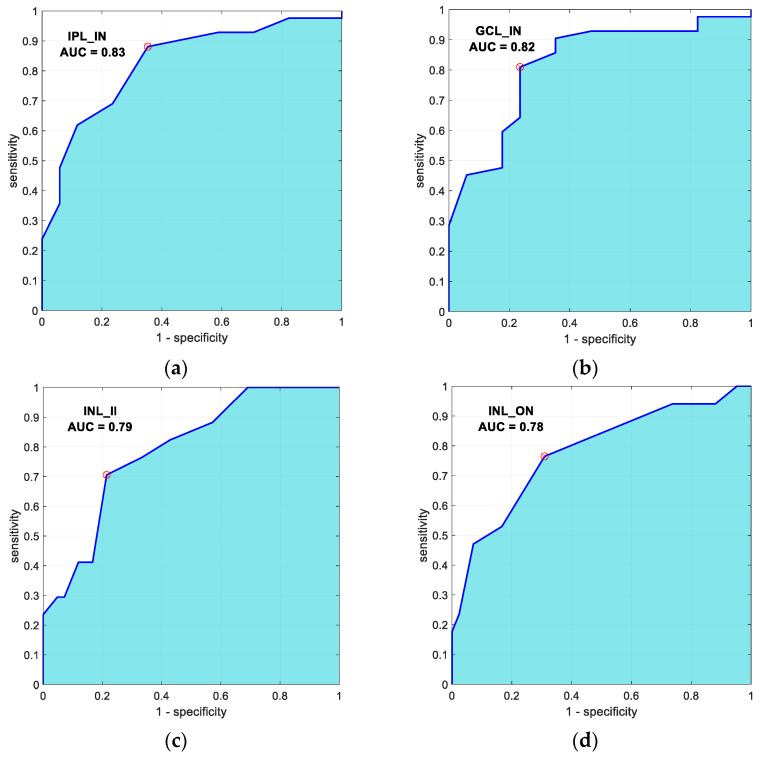
Figure 2.
ROC curves of the 4 optical coherence tomography variables with greatest discriminant capacity (control subjects vs. bipolar disorder patients). (a) Inner Plexiform layer-inner nasal (AUC = 0.83); (b) Ganglion cell layer-inner nasal (AUC = 0.82); (c) Inner nuclear layer- inner inferior (AUC = 0.79); (d) Inner nuclear layer-outer nasal (AUC = 0.78).

