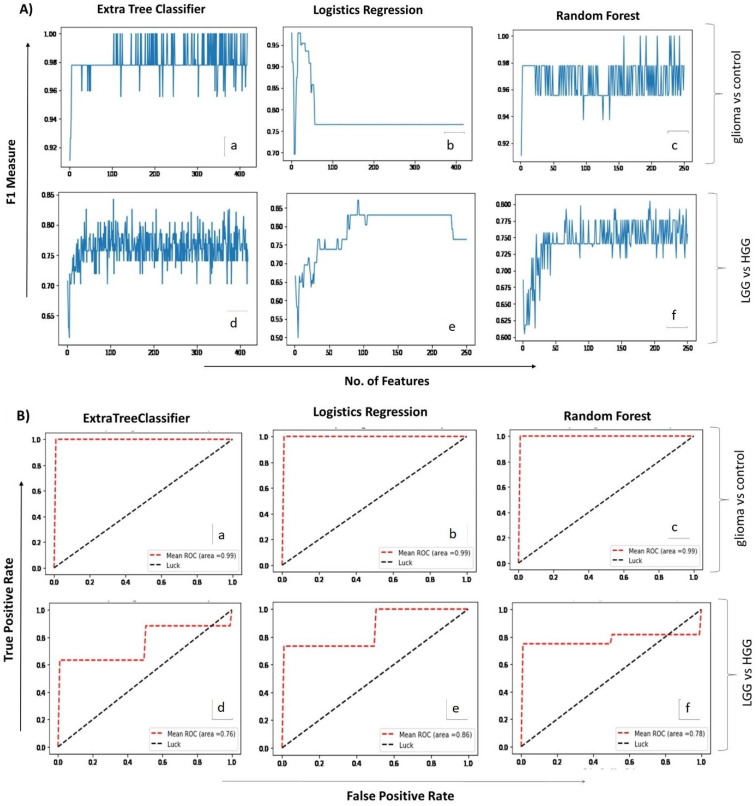
Figure 2.
(A). Mean score plots displaying the number of features (x-axis) and the corresponding F1 measures (y-axis) obtained for each of the three ML algorithms applied (i.e., extra tree classifier, logistic regression & random forest) for glioma vs control (a–c) and LGG vs HGG analysis (d–f), respectively. (B). Receiver operating curve (ROC) plots depicting predictive accuracy of the three ML algorithms for glioma vs control (a–c) and LGG vs HGG (d–f) groups, respectively. X-axis shows false positive rate while Y-axis indicates true positive rate on a scale of 0 to 1.0.

