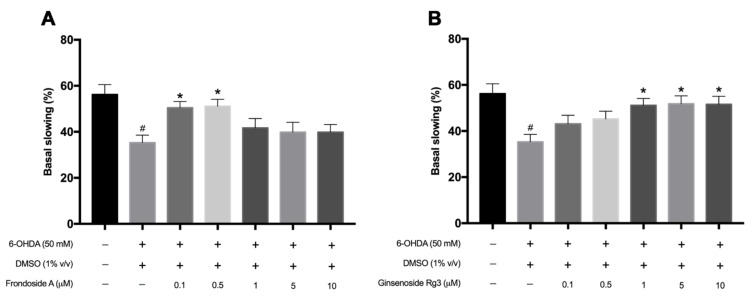
Figure 4.
Graphical representations for the basal slowing rate in 6-OHDA-induced N2 C. elegans treated with FA (A) and Rg3 (B). The hash (#) indicates a significant difference between 6-OHDA-induced and uninduced worms (p < 0.05). The asterisk (*) indicates a significant difference between the 6-OHDA-induced control worms and the FA/6-OHDA- or Rg3/6-OHDA-treated worms (p < 0.05). The experiment was performed independently at least three times (number of worms = 40–50 animals/group per replicate).

