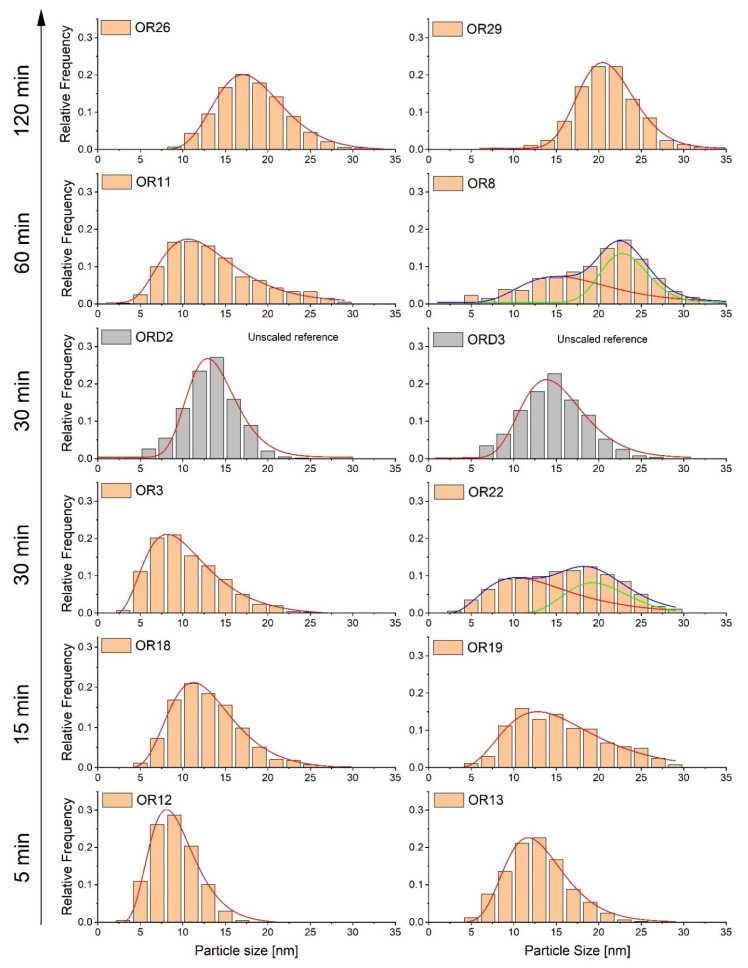
Figure 1.
Evolution of TEM particle size distributions of two extreme scaled-up samples heated during different times at the highest temperature (5, 15, 30, 60, 120 min). For each boiling point time, two samples with the highest and lowest average size were chosen. The grey distribution corresponds to the unscaled samples, ORD2 and ORD3.

