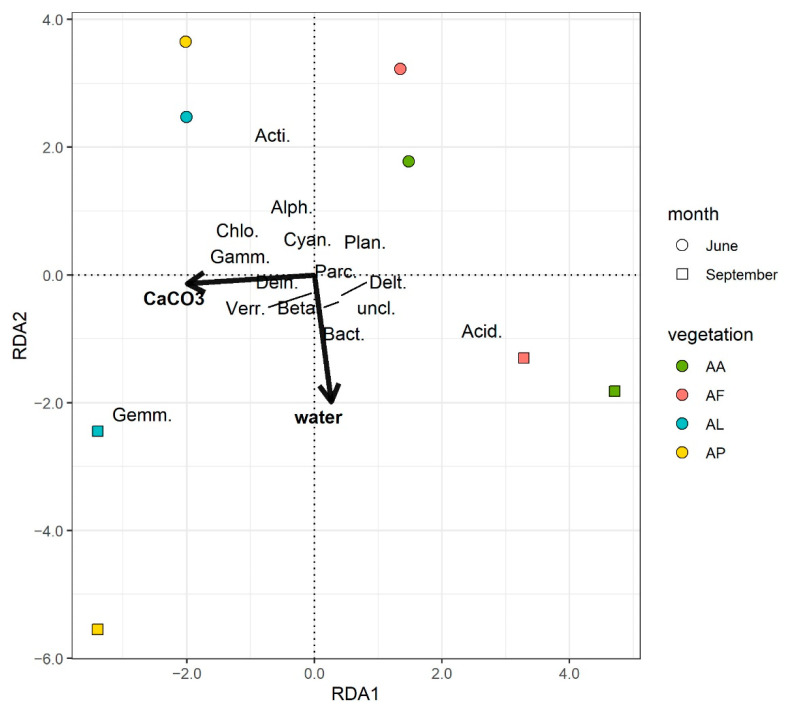
Figure 6.
Redundancy analysis plot of the final model for the phylogenetic (NGS) data. All taxa were included in the analysis, but for better readability only those that had at least a 0.1 absolute value for both axes are depicted on the plot. The lengths of the arrows for the environmental variables were also doubled for visibility purposes. CaCO3: percentage of CaCO3, water: water content of the soil samples (m/m%), Acid.: Acidobacteria, Acti.:Actinobacteria, Bact.: Bacteriodetes, Chlo.: Chloroflexi, Cyan.: Cyanobacteria, Dein.: Deinococcue-Thermus, Gemm.: Gemmatoidetes, Parc.: Parcubacteria, Plan.: Planctomycetes, Alph.: Alphaproteobacteria, Beta.: Betaproteobacteria, Delt.: Deltaproteobacteria, Gamm.: Gammaproteobacteria, Verr.: Verrucomicrobia, uncl.: Unclassified bacteria.

