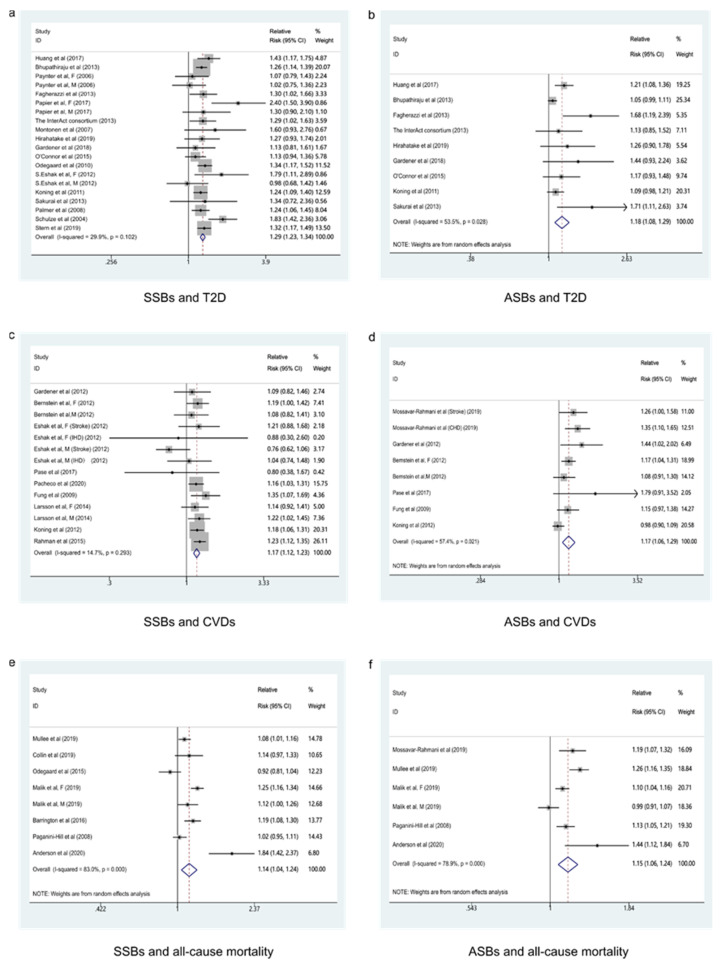
Figure 2.
Forest plot of RR for the association of sugar-sweetened beverages and artificially sweetened beverages consumption with the risk of type 2 diabetes, cardiovascular diseases, and all-cause mortality. (a) Forest plot of RR for SSBs and T2D. (b) Forest plot of RR for ASBs and T2D. (c) Forest plot of RR for SSBs and CVDs. (d) Forest plot of RR for ASBs and CVDs. (e) Forest plot of RRfor SSBs and all-cause mortality. (f) Forest plot of RR for ASBs and all-cause mortality. SSBs, sugar-sweetened beverages; ASBs, artificially sweetened beverage; T2D, type 2 diabetes; CVDs, cardiovascular diseases.

