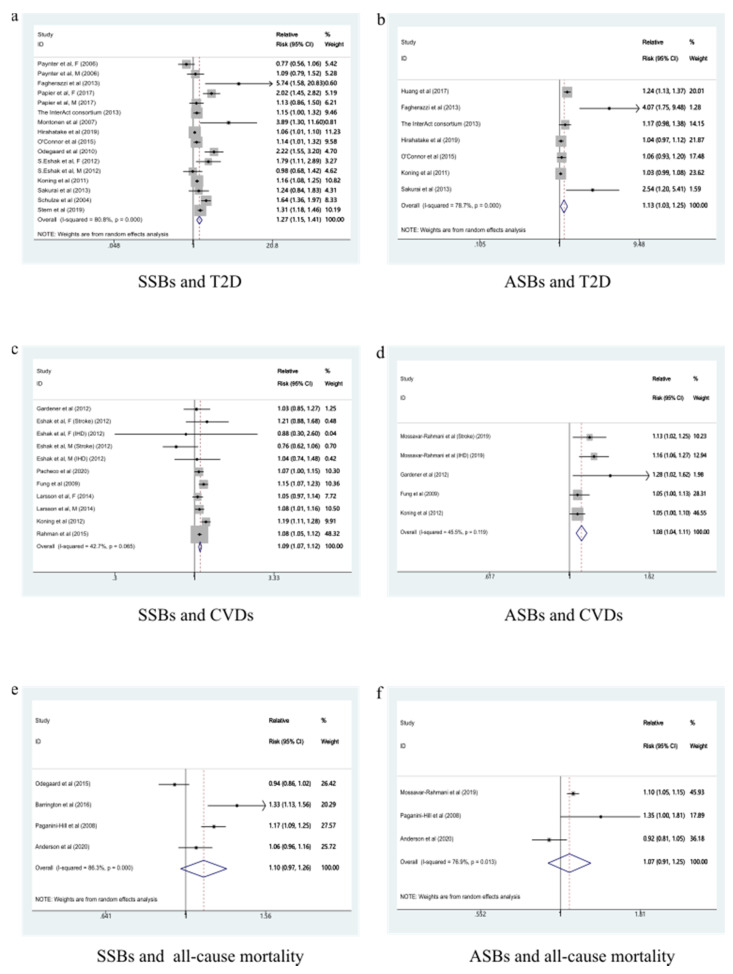
Figure 4.
Forest plot of RR for each additional SSB and ASB serving per day and the risk of type 2 diabetes, cardiovascular diseases, and all-cause mortality. (a) Forest plot of RR for each additional SSB serving per day and the risk of T2D. (b) Forest plot of RR for each additional ASB serving per day and the risk of T2D. (c) Forest plot of RR for each additional SSB serving per day and the risk of CVDs. (d) Forest plot of RR for each additional ASB serving per day and the risk of CVDs. (e) Forest plot of RR for each additional SSB serving per day and the risk of all-cause mortality. (f) Forest plot of RR for each additional ASB serving per day and the risk of all-cause mortality. SSBs, sugar-sweetened beverages; ASBs, artificially sweetened beverages; T2D, type 2 diabetes; CVDs, cardiovascular diseases.

