Figure 4.
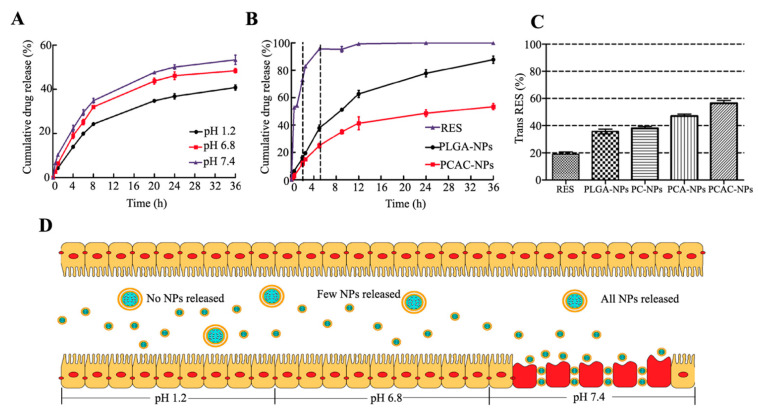
In vitro drug release: (A) Release curves of PCAC-NPs at pH 1.2, pH 6.8 and pH 7.4, respectively. (B) Release curves of RES, PLGA-NPs and PCAC-NPs in simulated digestive system. (C) Retention percentage of RES, PLGA-NPs, PC-NPs, PCA-NPs and PCAC-NPs exposed to ultraviolet light for 120 min. (D) Schematic simulation of PCAC-NPS from entering the gastric environment to being adsorbed to the inflammatory site of the colon. (In the simulated gastric environment at pH 1.2, almost no NPs release drugs. Then, the NPs enter the simulated small intestine environment at pH 6.8, and a few NPs begin to release drugs. Finally, the NPs enter the simulated colon at pH 7.4, and most of the NPs adhere to the site of inflammation and all NPs release drugs.)

