Figure 1.
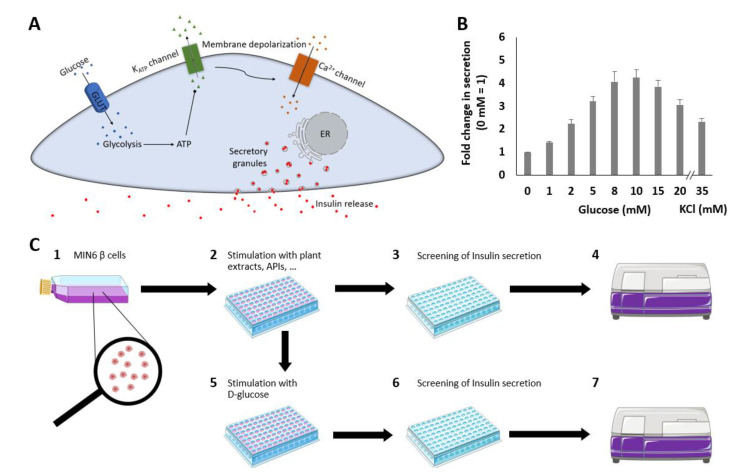
Schematic overview of the GSIS pathway from pancreatic β cells that produce and secrete insulin in response to changes in ambient blood glucose concentrations. Glucose enters the cell via the glucose transporter GLUT2 and is metabolized to pyruvate and ATP. The generated ATP binds to and closes ATP-dependent potassium channels (KATP channels). Due to channel closure, potassium exit is blocked, resulting in depolarization of the cell membrane. Voltage-gated calcium channels are thus triggered, and an influx of calcium occurs. The elevated cytoplasmic calcium concentration triggers the release of insulin and C-peptide in equimolar amounts (A). Insulin secretion depending on different glucose concentrations in MIN6 β cells and in response to 35 mM KCl. Fold changes in the secreted luciferase activity expressing Ins-GLuc normalized to the activity of 0 mM glucose and expressed as fold change ± SEM. Data are the average of at least three independent experiments with a minimum of 17 replicates in total (B). Schematic overview of the insulin secretion stimulation and suppression assay (C). MIN6 β cells were cultured in flasks or dishes, trypsinized, counted and diluted in cell culture media (1). Cells (200 µL) were aliquoted into wells of a 96-well plate and cultured before washing and starving in KRPH buffer and incubation with plant extracts (2). Fifty microliters of supernatant were removed, pipetted into a white 96-well plate and mixed with working solution (3). Luminescence was measured immediately after pipetting (4). To test the suppression of insulin secretion of the plant extracts, 10 mM glucose was added (5) after incubation with different plant extracts (2). Assay preparation and measurements (6, 7) were performed as described previously (3, 4).

