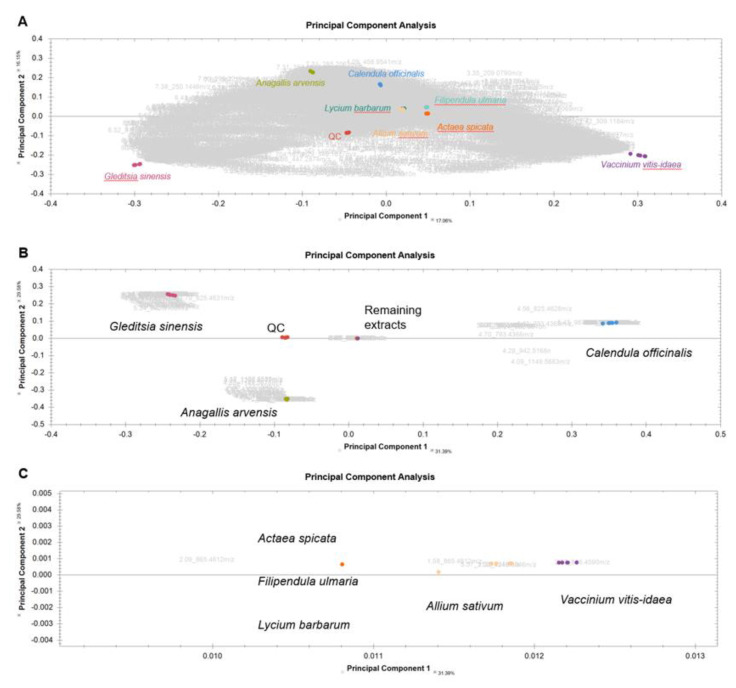
Figure A7.
Principal components analysis (PCA) biplot showing scores (colored dots) and loadings (compound IDs in grey with retention time and m/z values) of UPLC-ESI-IMS-TOF MS runs of selected plant extracts. Different colors refer to different plant species. The QC scores are depicted in red. (A) PCA of all compounds (no filters), (B) PCA with only possible identifications and (C) zoomed-in area.

